Stability curves
Analytical platforms B – H
B: GC-MS/MS
Amino and carboxylic acids.
- Methylmalonic acid
- Total homocysteine
- Total cysteine
- Methionine
- Serine
- Glycine
- Cystathionine
- Sarcosine
- Histidine
- Tryptophan
- Kynurenine
- Ornithine
- Aspartic acid
- Glutamic acid
- Lysine
- Alanine
- Phenylalanine
- Isoleucine
- Leucine
- Proline
- Valine
- Asparagine
- Glutamine
- Threonine
- Tyrosine
- α-Ketoglutaric acid
- 3-Hydroxyisobutyrate
- 2-Hydroxybutyrate
- 3-Hydroxybutyrate
- Acetoacetate
- Carboxymethyllysine
- Carboxyethyllysine
- 2-Aminoadipic acid
C: LC-MS/MS
Choline derivatives.
Charged, methylated or sulfur amino acids.
Short- and medium-chain acylcarnitines.
D: LC-MS/MS
Kynurenine pathway and B vitamins (B1, B2, B3, B6).
- Pyridoxal 5′-phosphate
- Pyridoxal
- 4-Pyridoxic acid
- Pyridoxine
- Thiamine
- Thiamine monophosphate
- Thiamine + thiamine monophosphate
- Riboflavin
- Riboflavin+FMN
- Flavin mononucleotide
- Cystathionine
- Neopterin
- Tryptophan
- Kynurenine
- Kynurenic acid
- Anthranilic acid
- 3-Hydroxykynurenine
- Xanthurenic acid
- 3-Hydroxyanthranilic acid
- HK:XA ratio
- HKr
- Picolinic acid
- Quinolinic acid
- Nicotinic acid
- Nicotinamide
- N1-methylnicotinamide
- Cotinine
- Trans-3′-hydroxycotinine
- Trigonelline
E: LC-MS/MS
Folate species and catabolites.
- 5-Methyl-tetrahydrofolate
- 5-methyltetrahydrofolate+4-α-hydroxy-5-methyl-THF
- 5-Formyl-tetrahydrofolate
- Folic acid
- 4-α-hydroxy-5-methyl-THF
- Para-aminobenzoylglutamate
- Acetamidobenzoylglutamate
- Folate as pABG equivalents
F: Microbiological assay
Folate (B9) and cobalamin (B12).
G: MALDI-TOF MS
Protein biomarkers and proteoforms.
H: LC-MS/MS
Lipid-soluble vitamins and long-chain acylcarnitines.
- All-trans retinol
- 25-Hydroxy vitamin D2
- 25-Hydroxy vitamin D3
- α-tocopherol
- γ-tocopherol
- Phylloquinone
- Menaquinone-4
- B
- C
- D
- E
- F
- G
- H
Amino- and carboxylic acids.
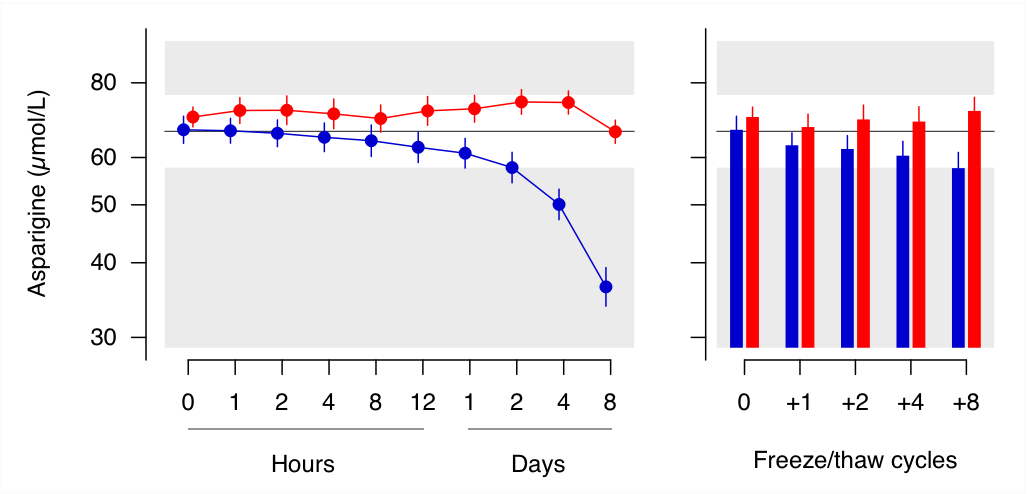
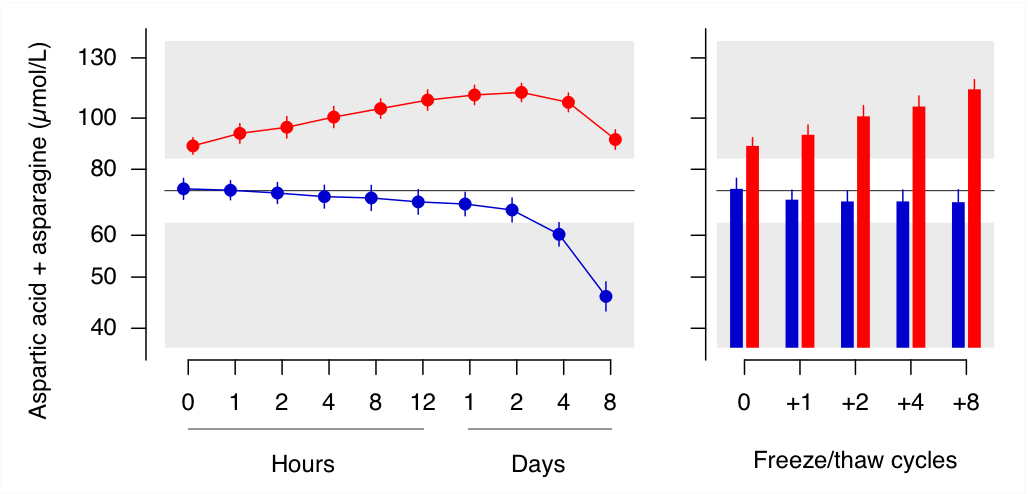
For the pair of asparagine / aspartic acid characterized by interconversion, the lower panel shows the concentration of the two metabolites combined. Thus, summarizing the concentrations of such source-product pairs is a useful strategy to correct for preanalytical instability.
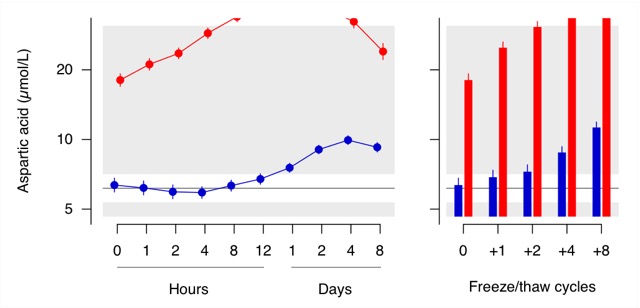

For the pair of asparagine / aspartic acid characterized by interconversion, the lower panel shows the concentration of the two metabolites combined. Thus, summarizing the concentrations of such source-product pairs is a useful strategy to correct for preanalytical instability.
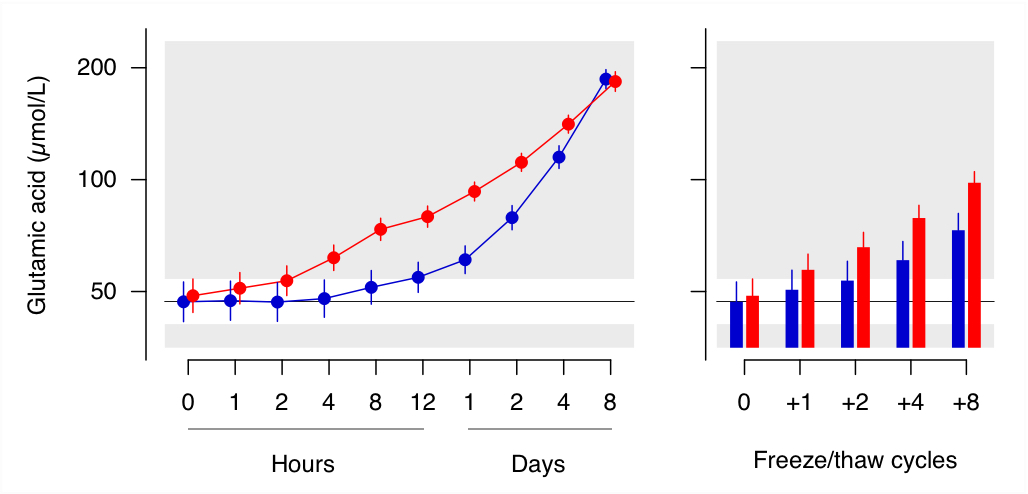
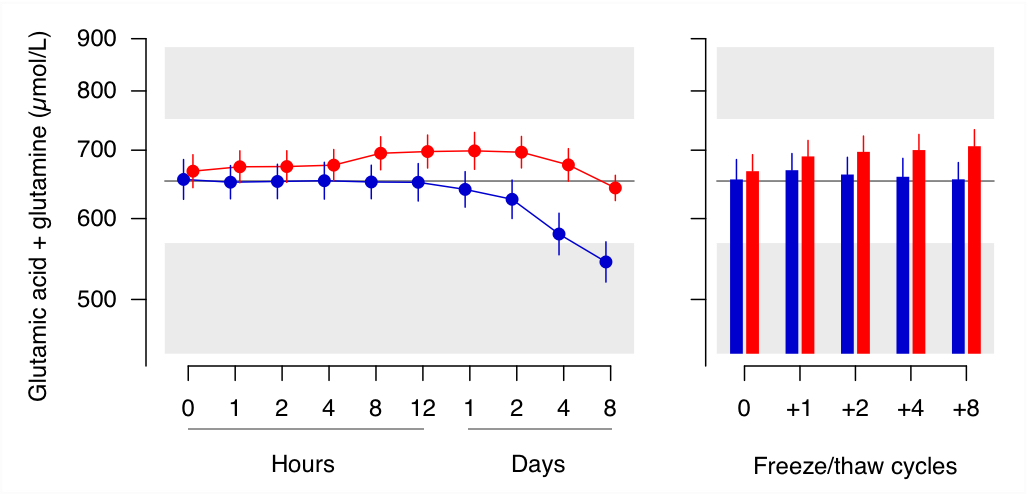
For the pair of glutamine / glutamic acid characterized by interconversion, the lower panel shows the concentration of the two metabolites combined. Thus, summarizing the concentrations of such source-product pairs is a useful strategy to correct for preanalytical instability.
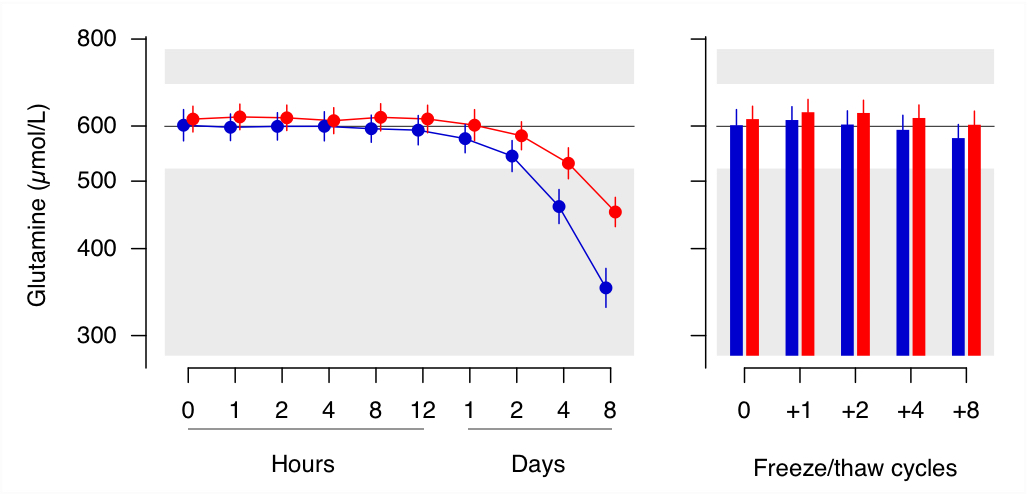

For the pair of glutamine / glutamic acid characterized by interconversion, the lower panel shows the concentration of the two metabolites combined. Thus, summarizing the concentrations of such source-product pairs is a useful strategy to correct for preanalytical instability.
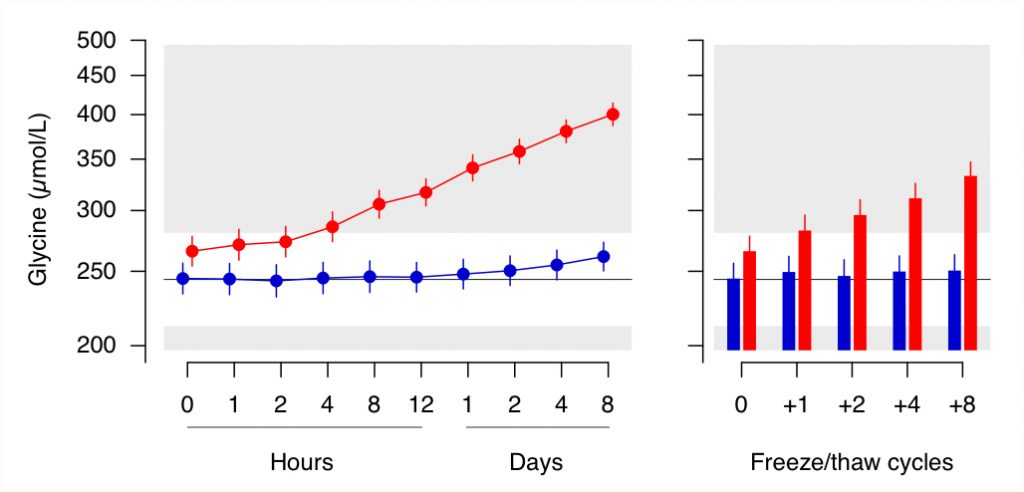
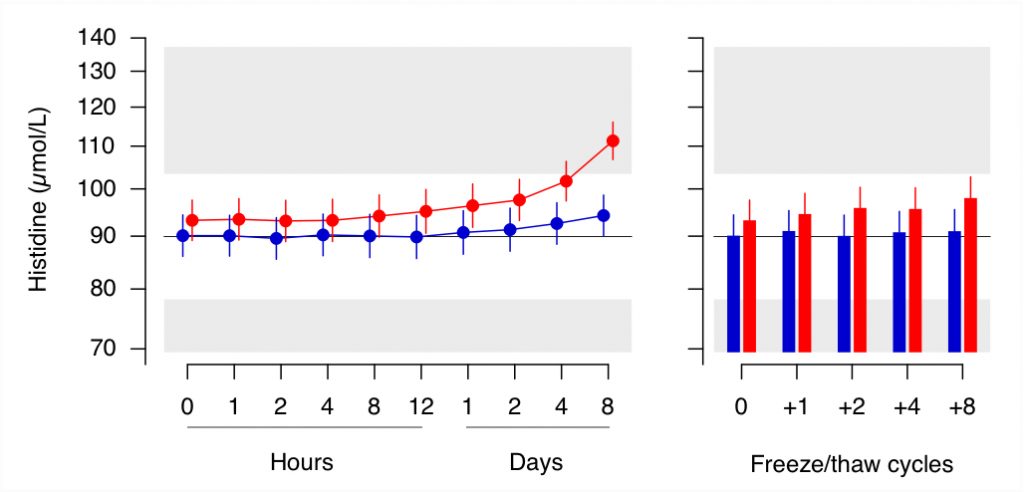
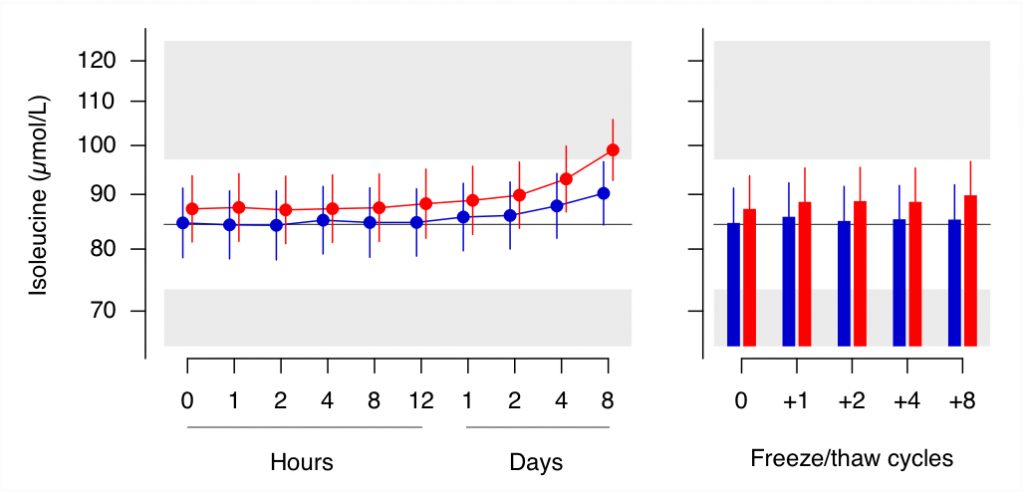
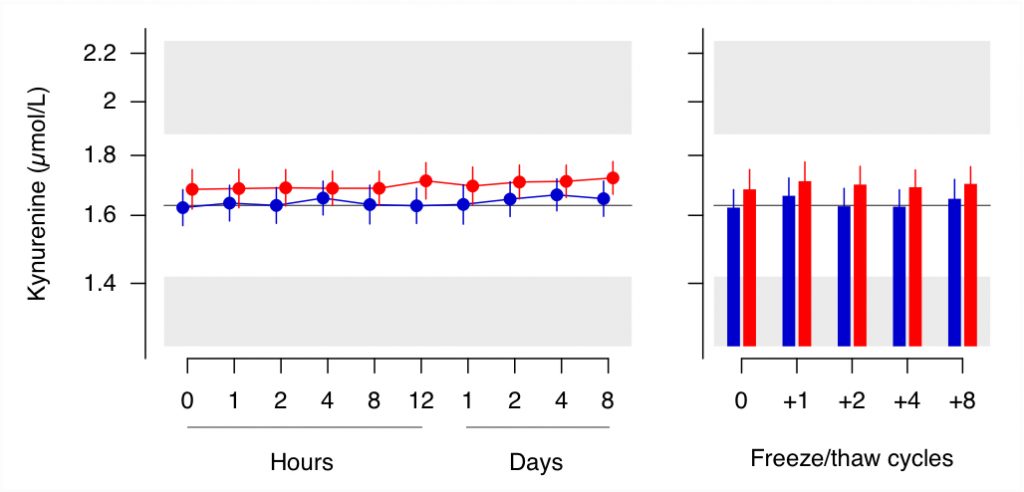

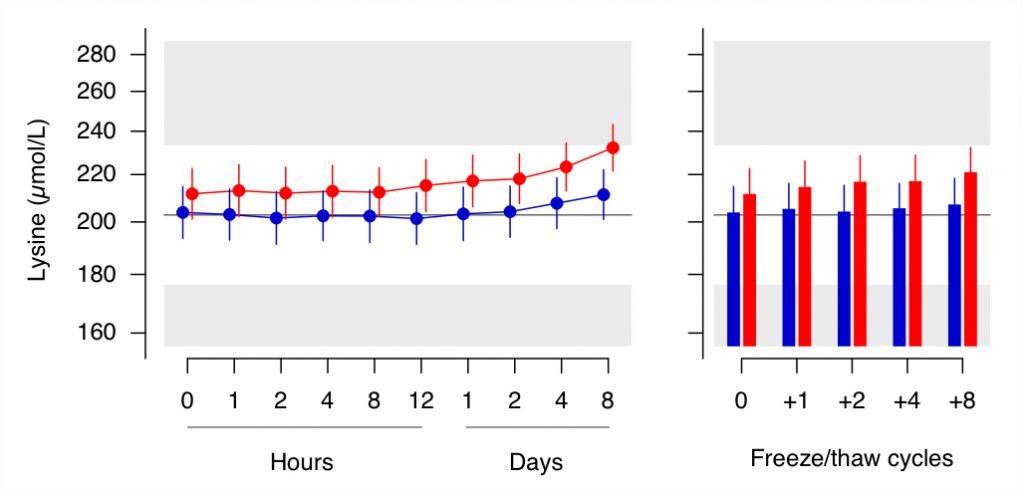
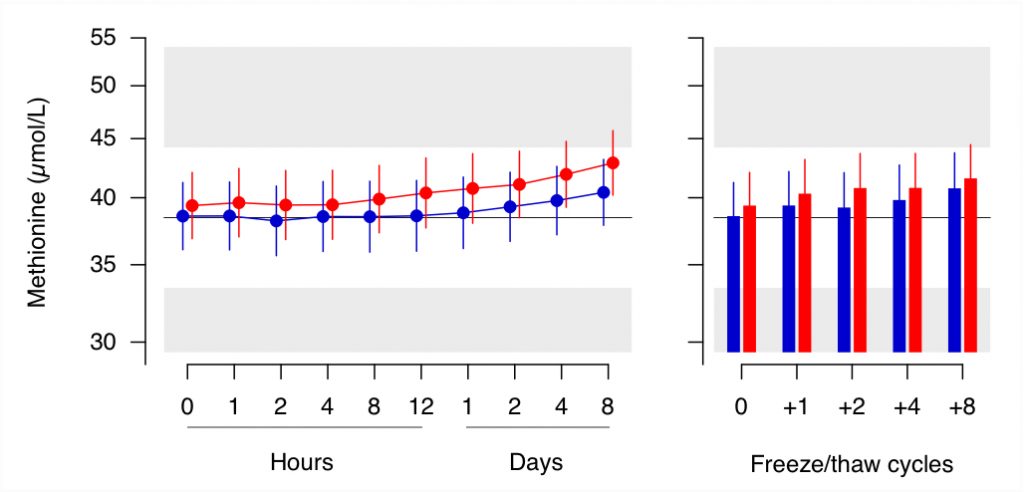
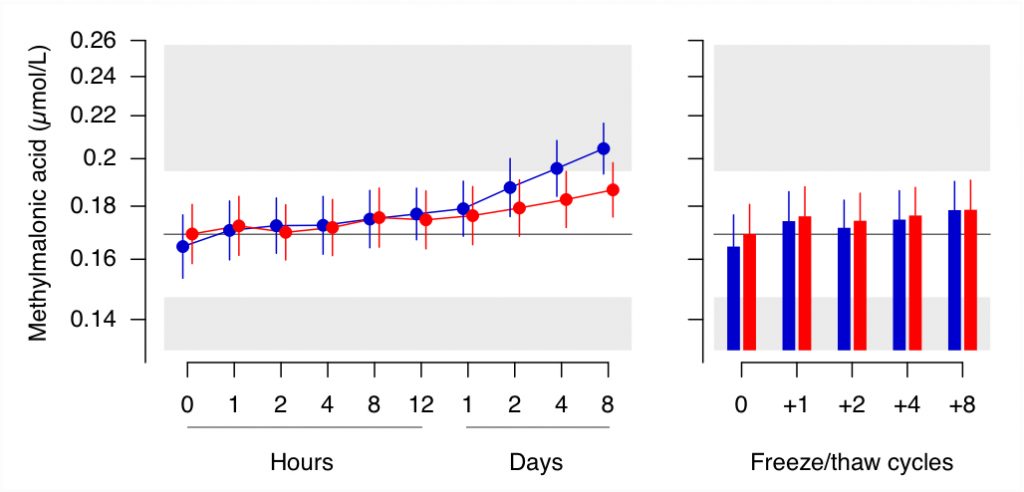
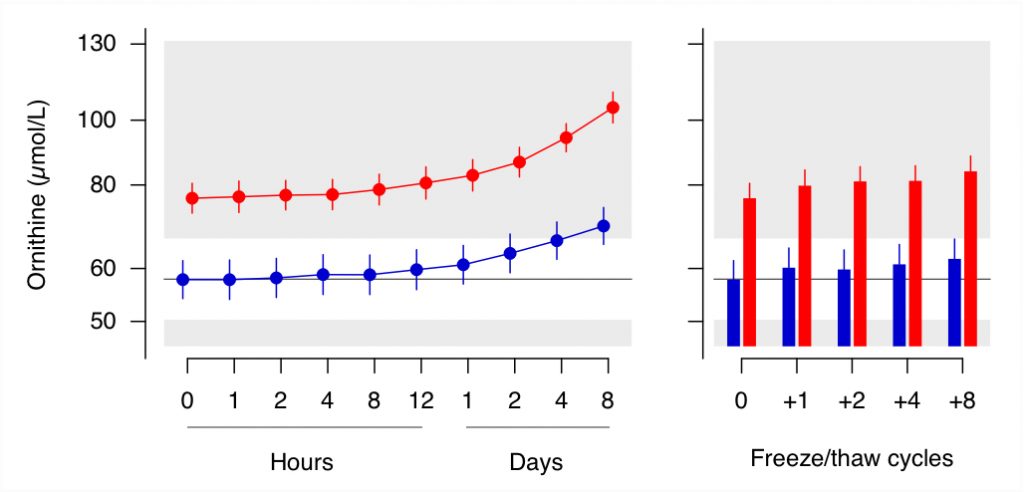
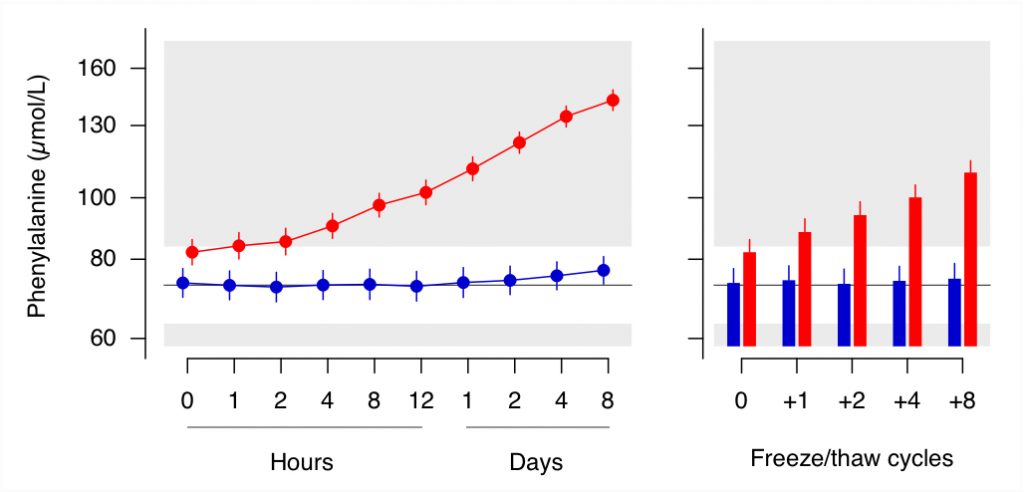
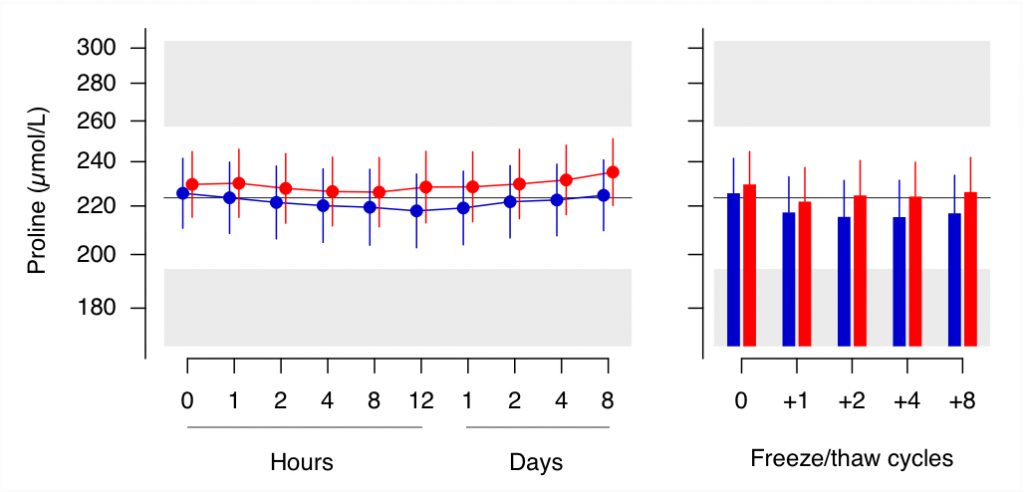
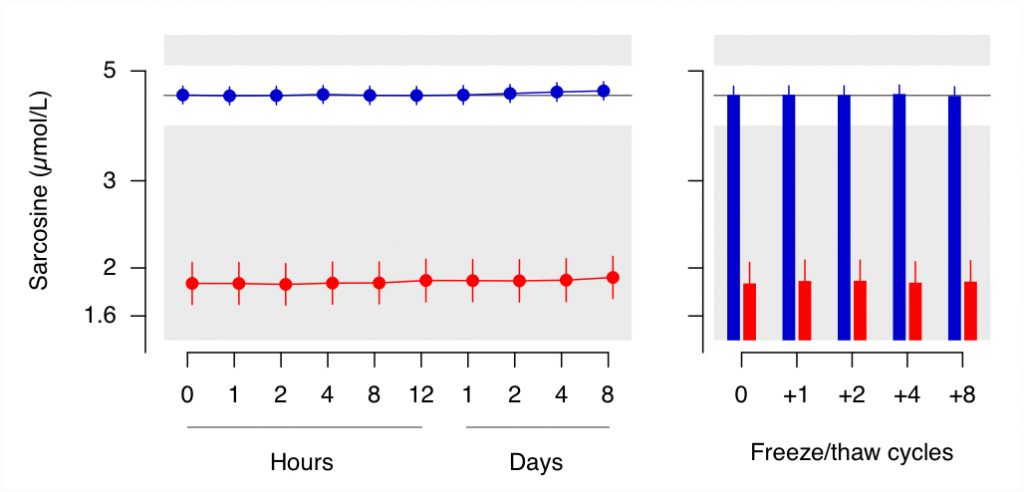
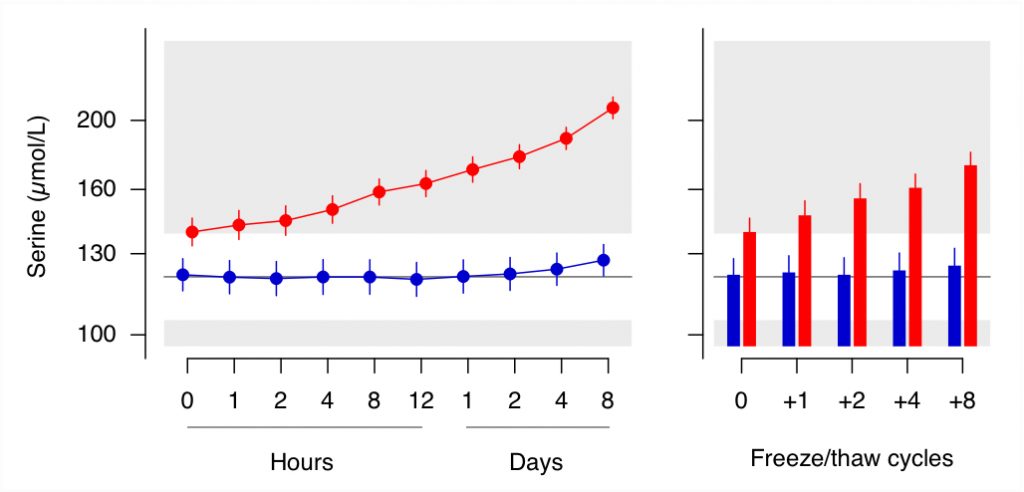
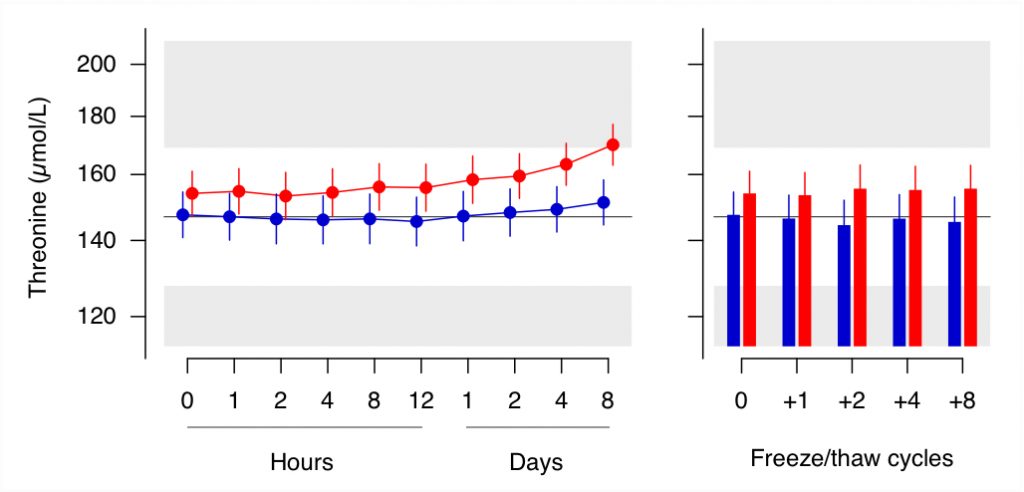
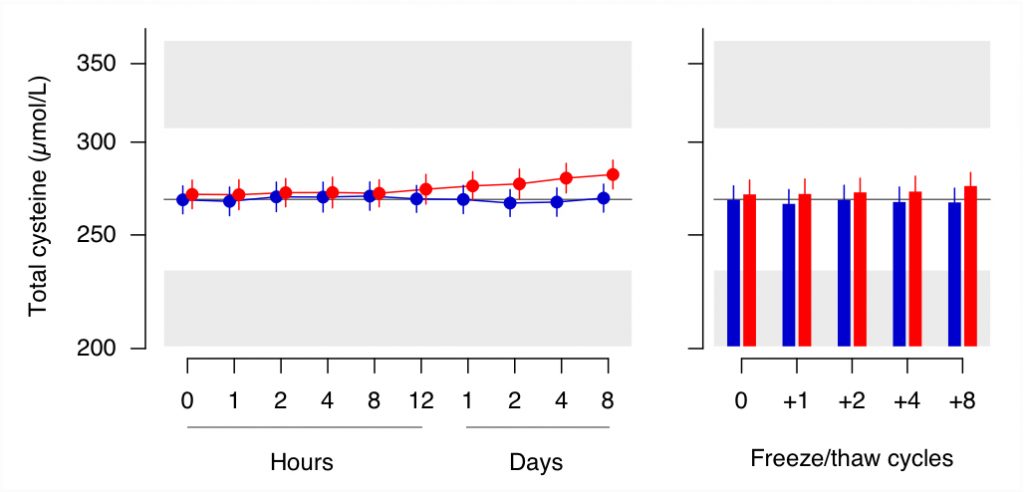
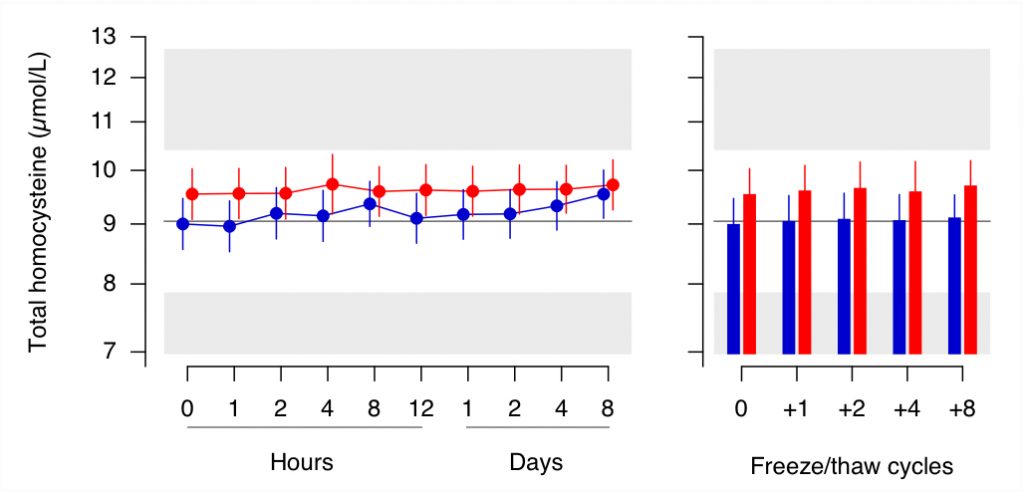
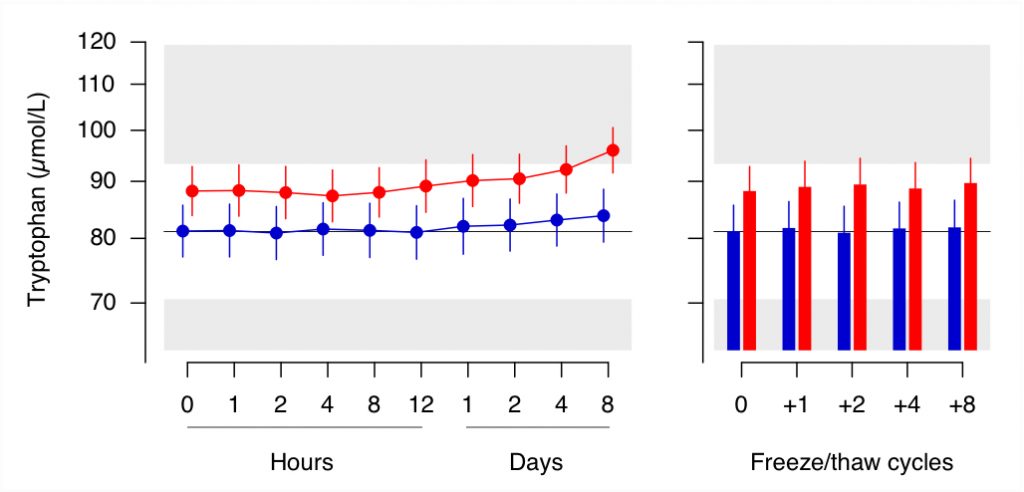
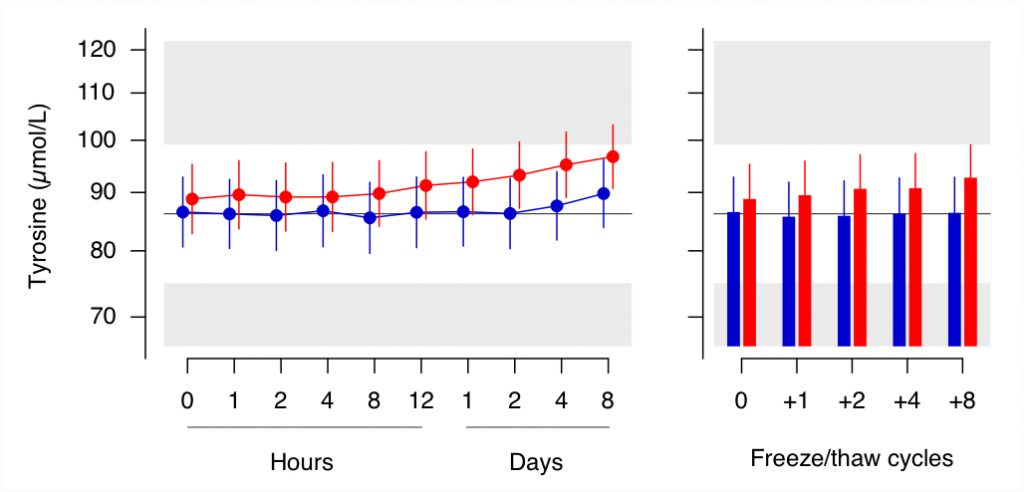

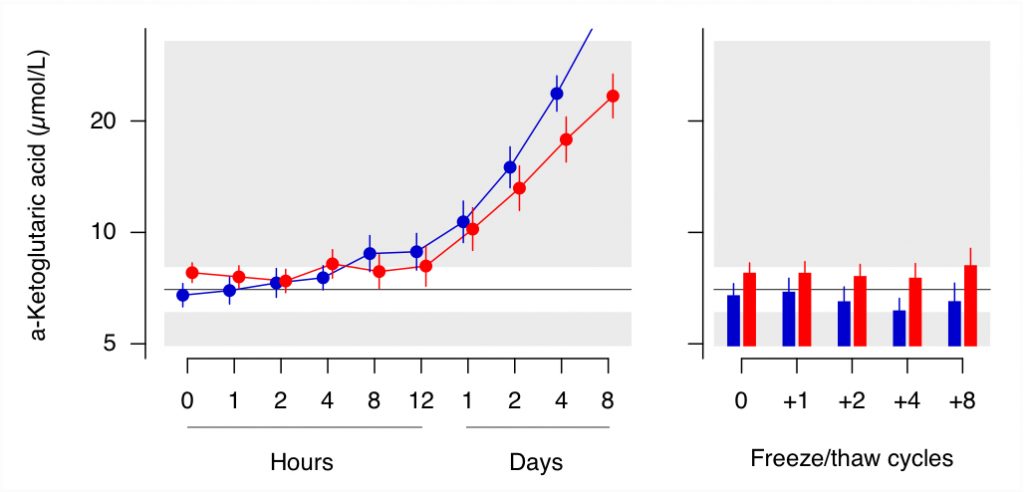
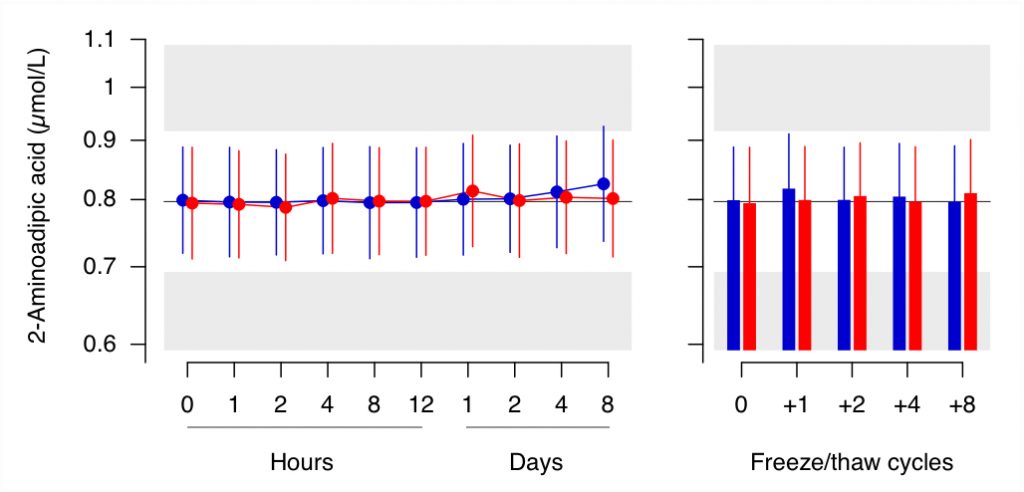
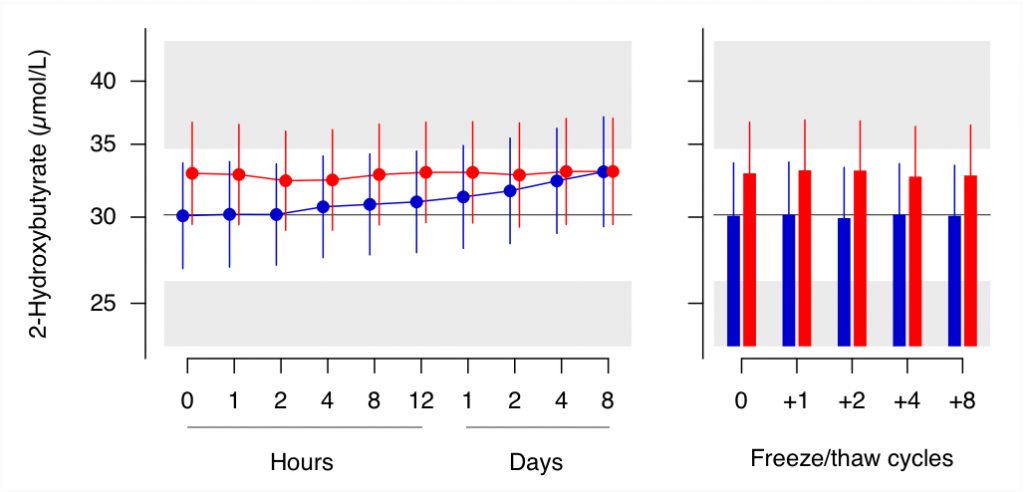
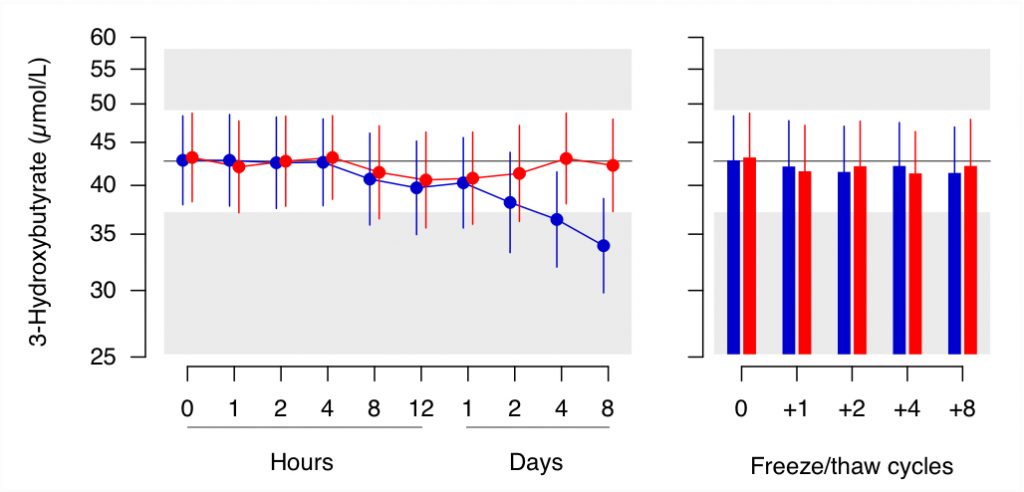
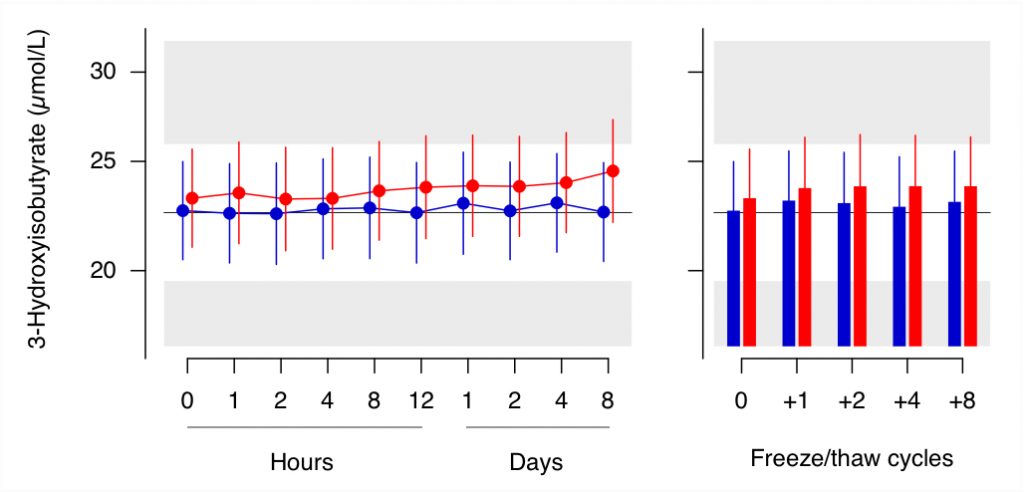
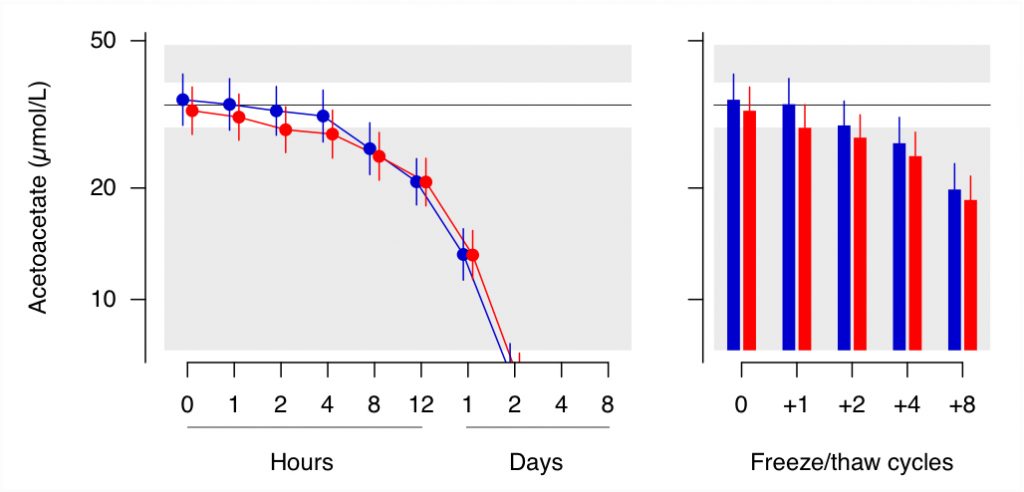
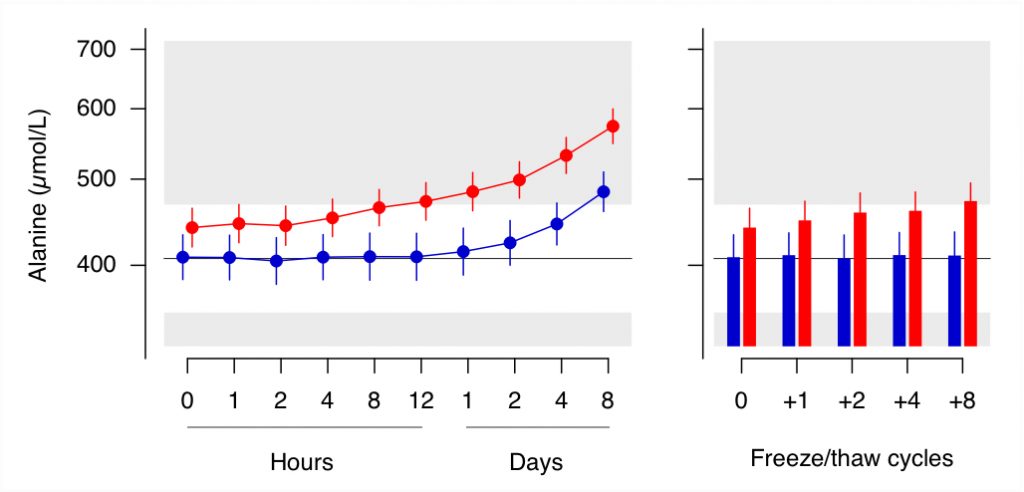
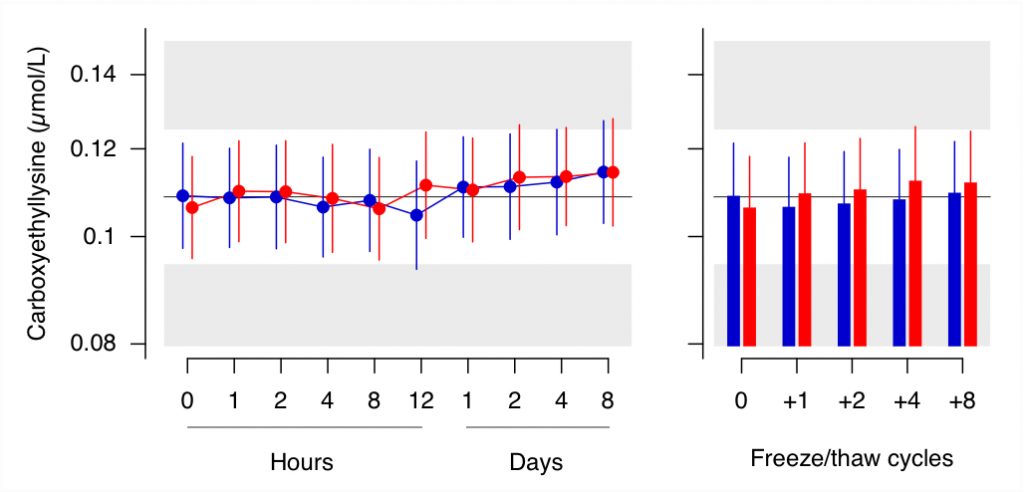
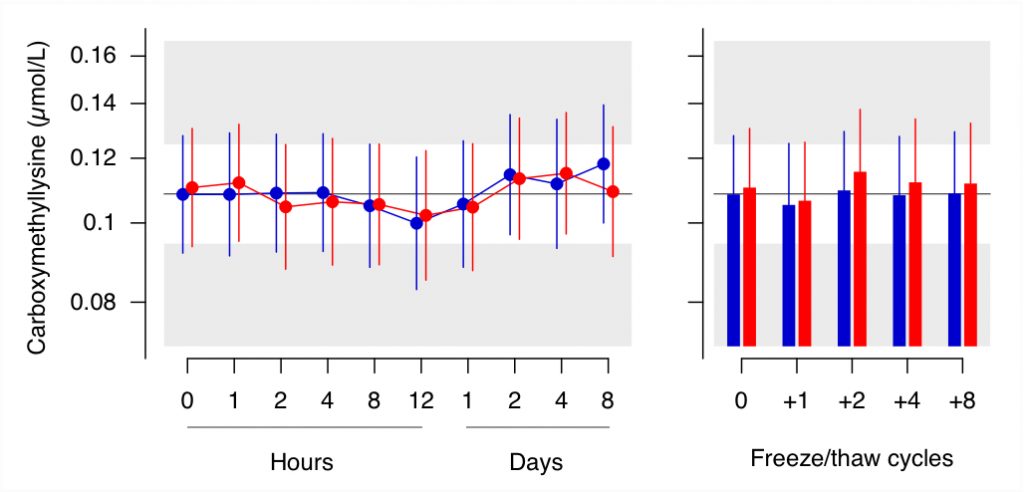
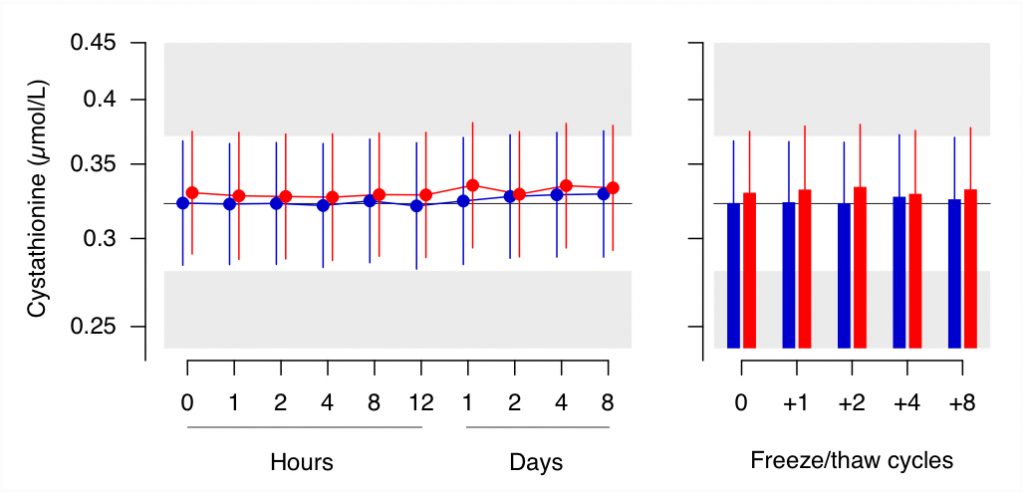
The panels (click on biomarkers above) show the stability of all biomarkers in EDTA plasma and serum at room temperature (left) for the indicated duration and after increasing number of freeze-thaw cycles (right). The white zone indicates +/- 15% deviation from the average of the first three time points for plasma. Data are given as geometric mean with standard error (SE) for samples from 15 healthy subjects.
Choline derivatives. Charged, methylated or sulfur amino acids.
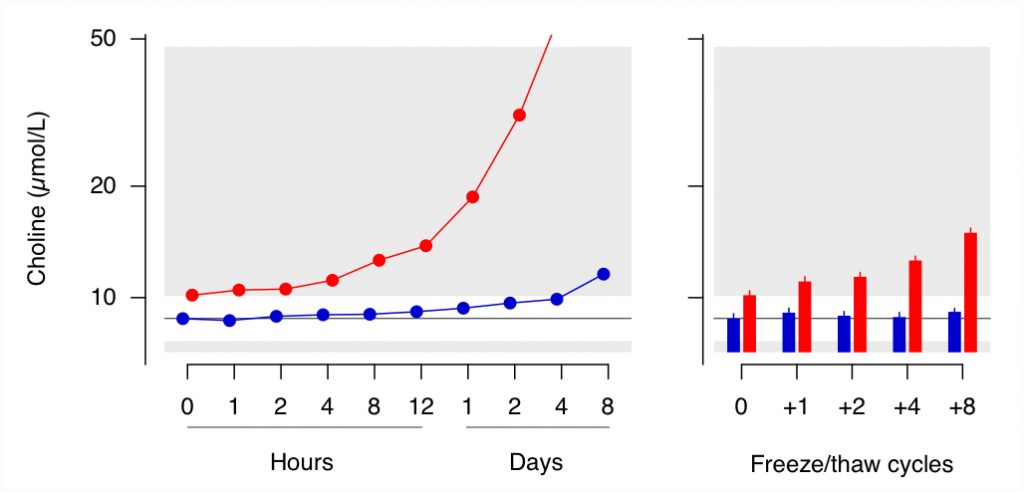

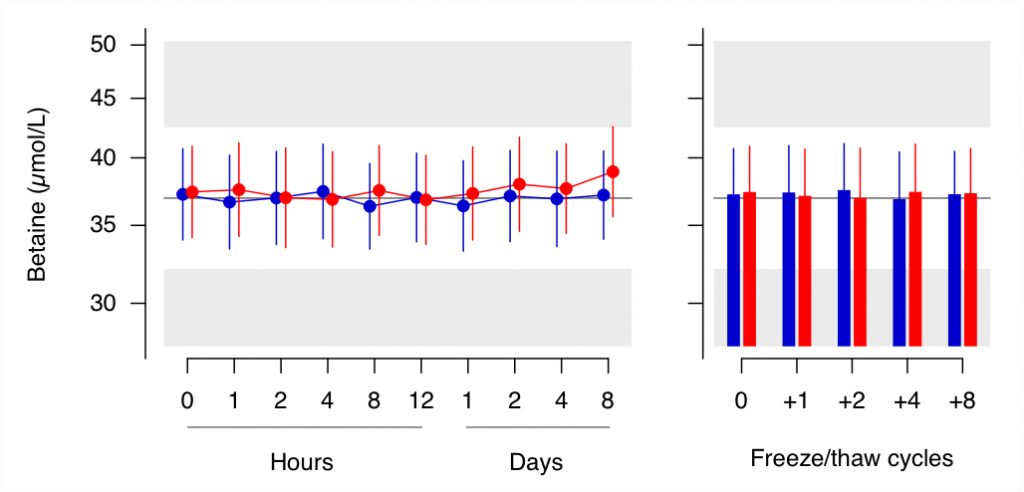
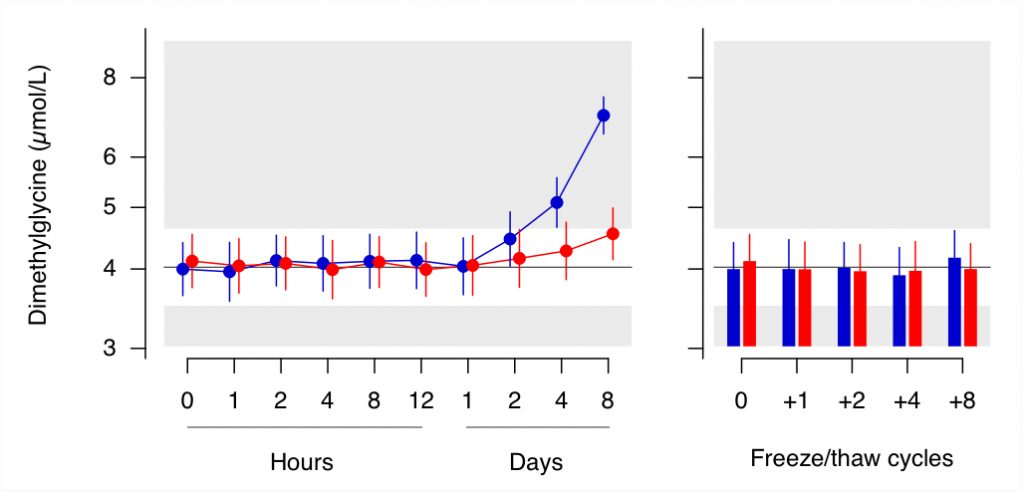

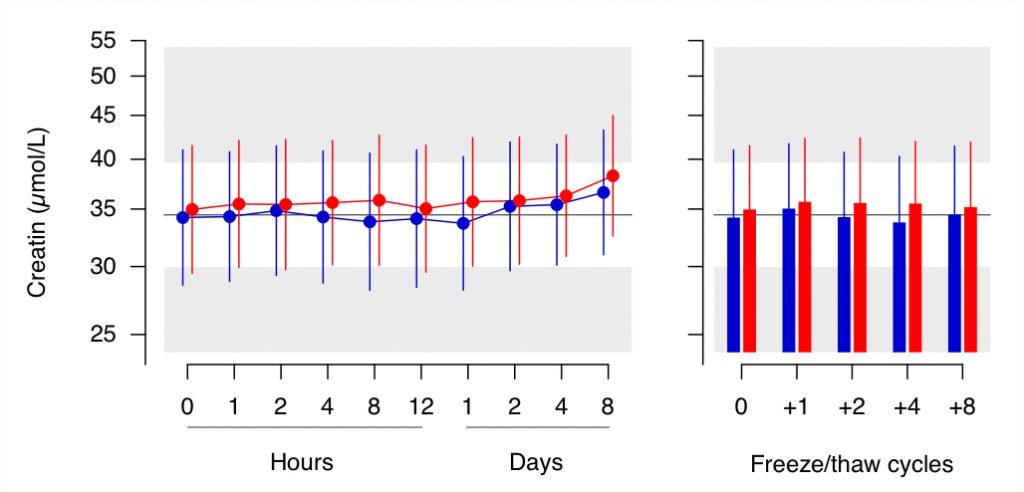
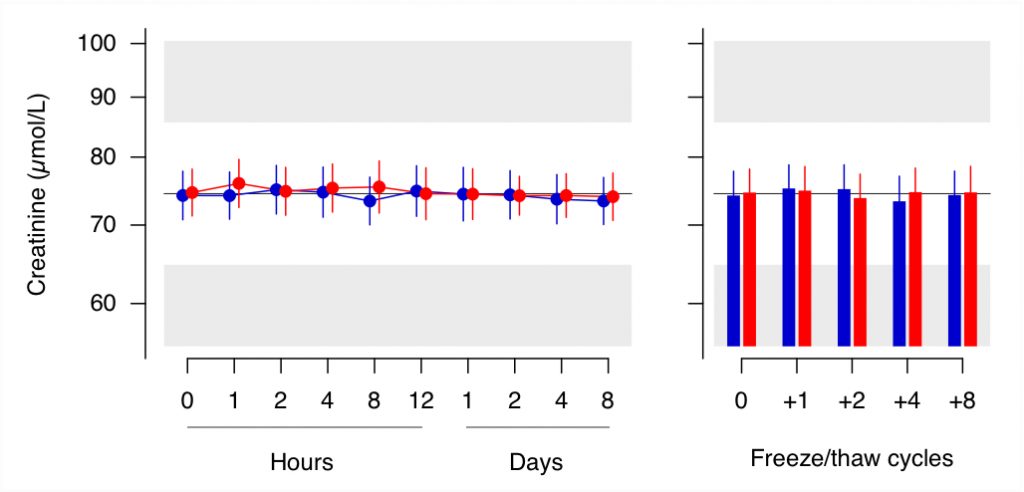

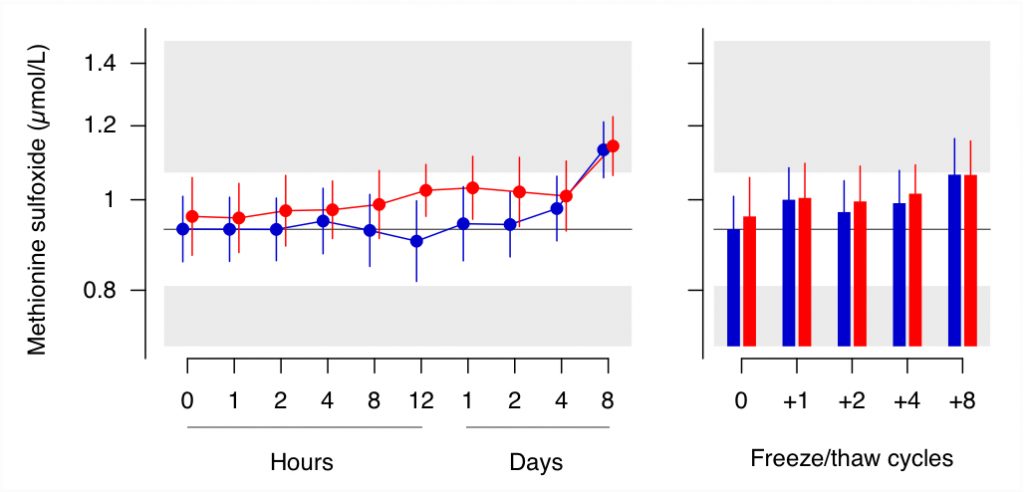


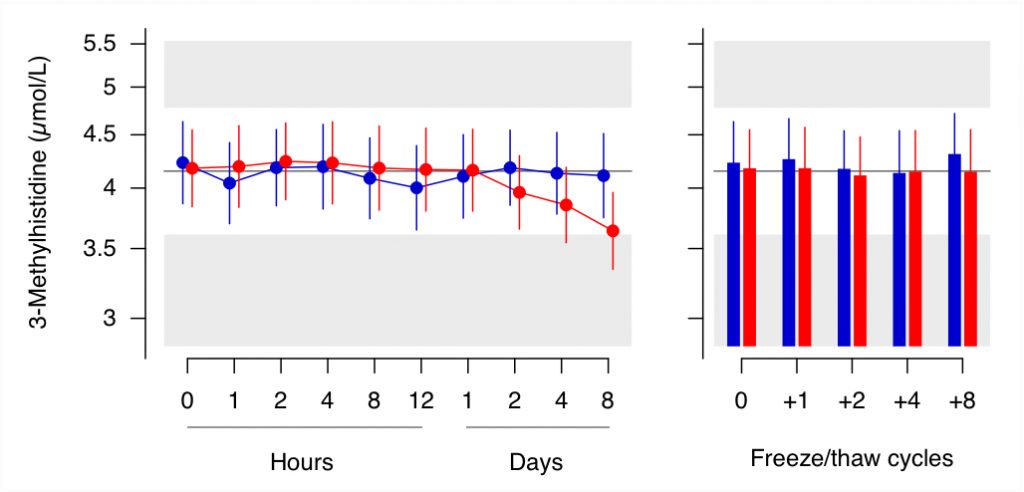

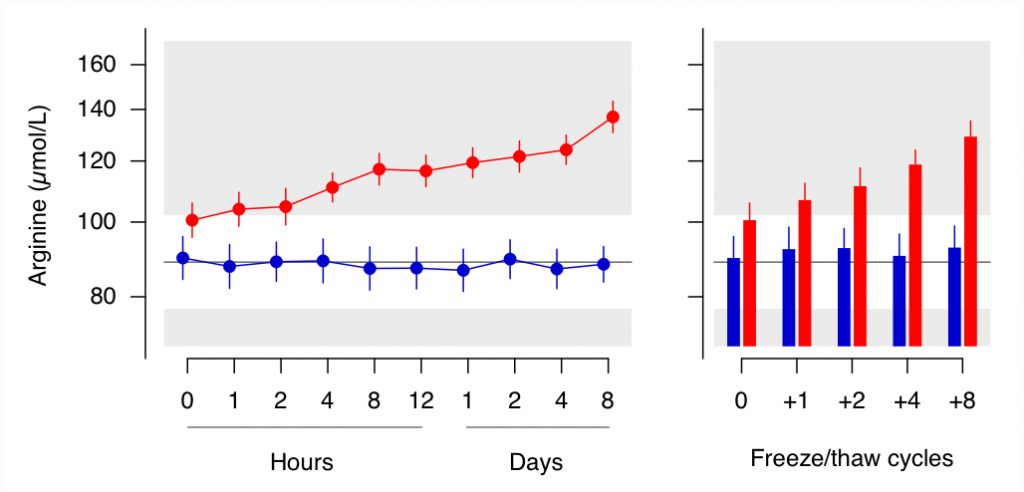
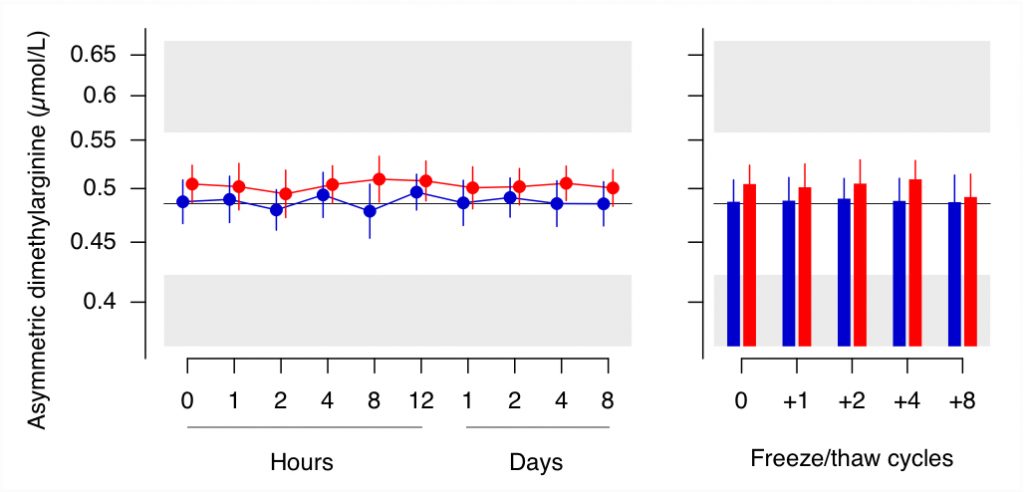
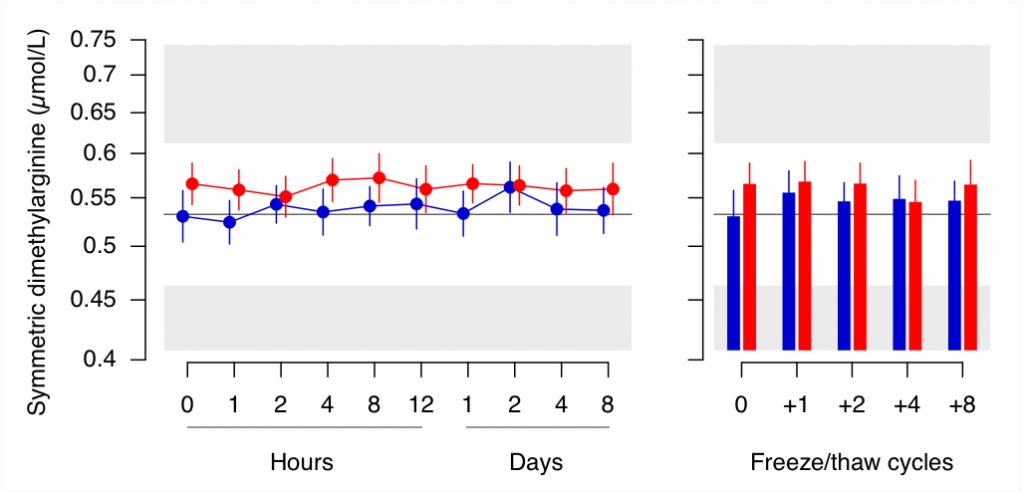
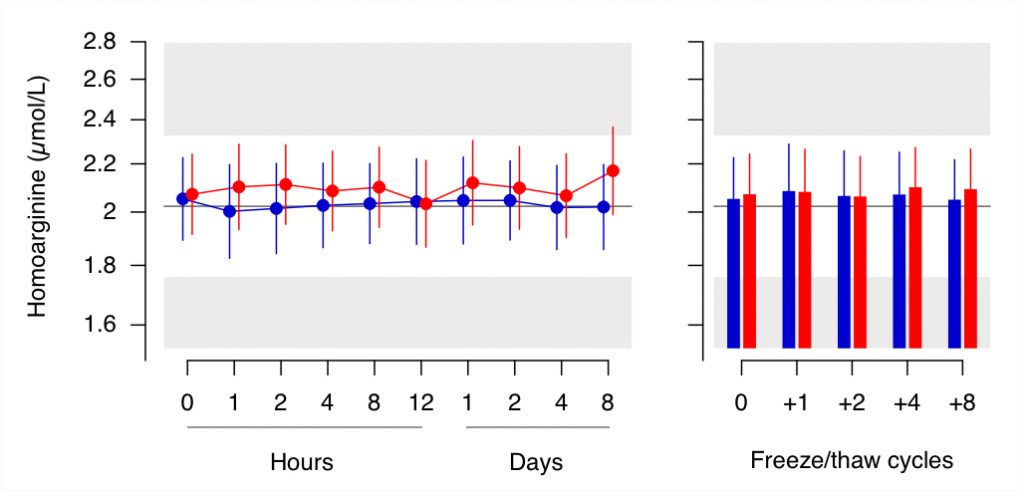
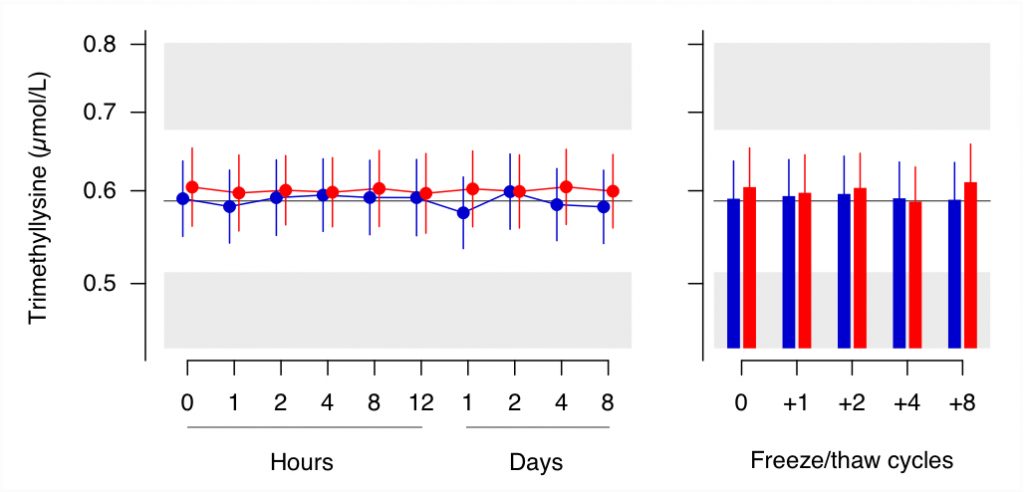
The panels (click on biomarkers above) show the stability of all biomarkers in EDTA plasma and serum at room temperature (left) for the indicated duration and after increasing number of freeze-thaw cycles (right). The white zone indicates +/- 15% deviation from the average of the first three time points for plasma. Data are given as geometric mean with standard error (SE) for samples from 15 healthy subjects.
Kynurenine pathway and B vitamins (B1, B2, B3, B6), nicotin, coffee markers, and inflammation markers.
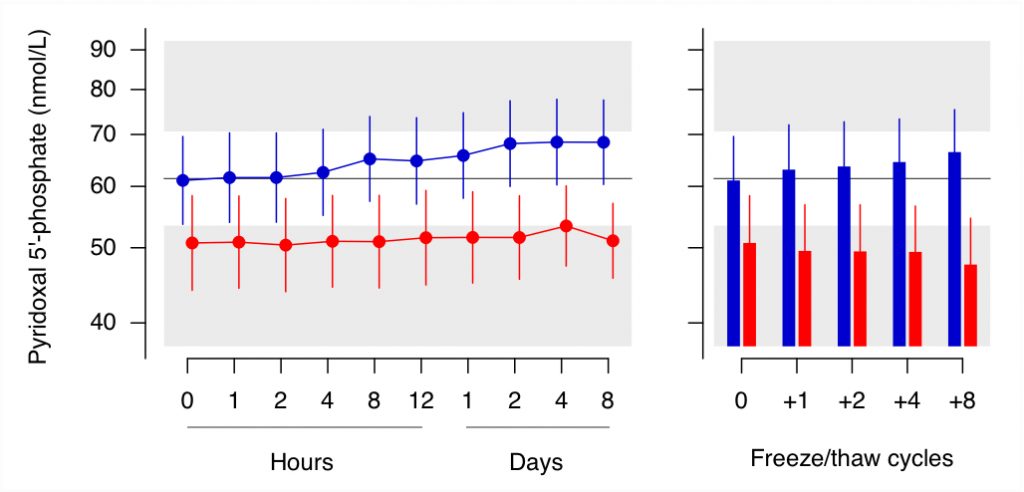
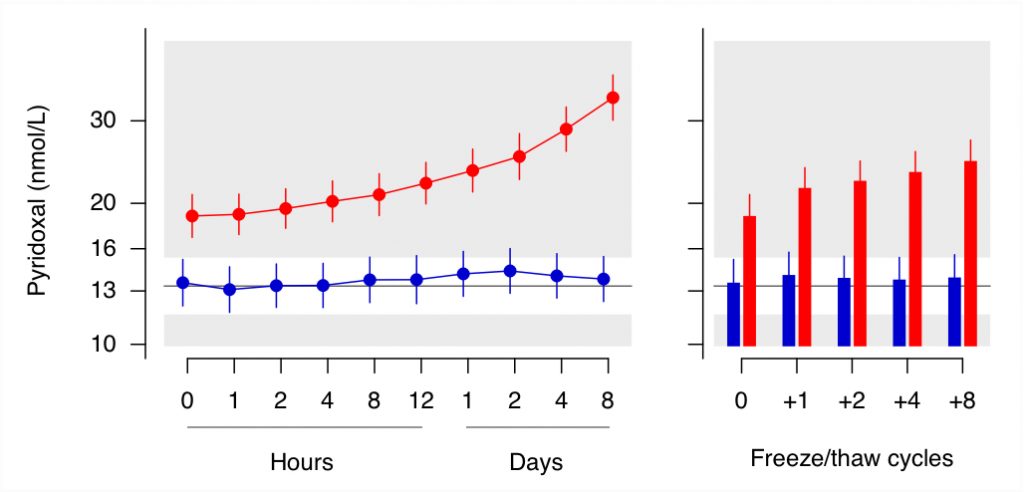
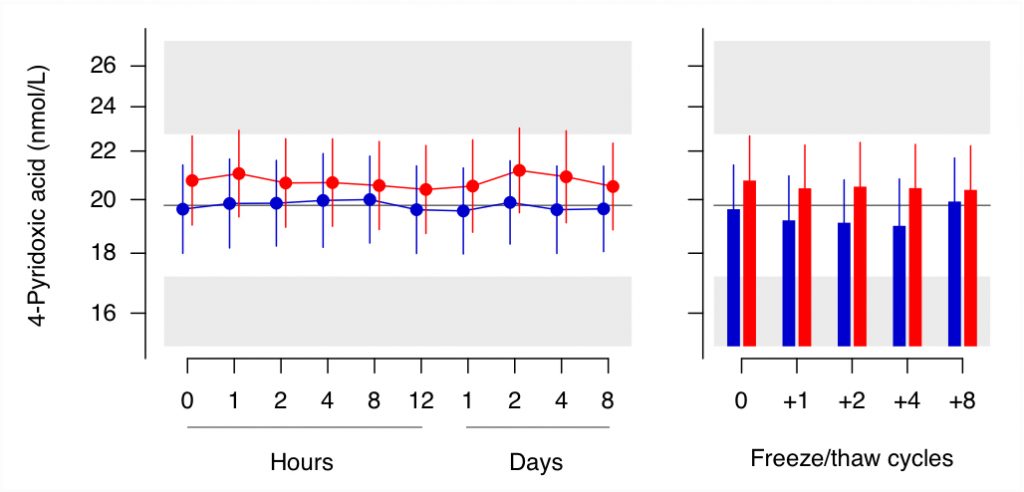
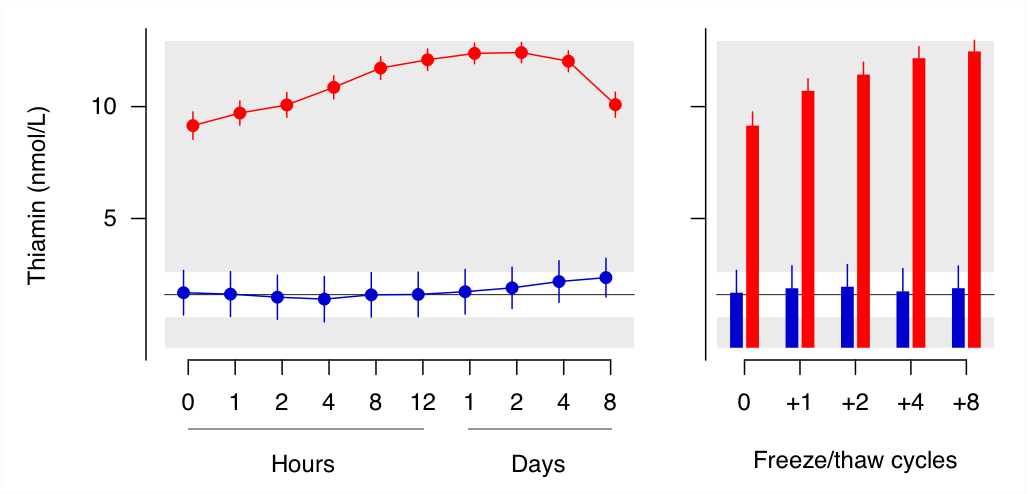
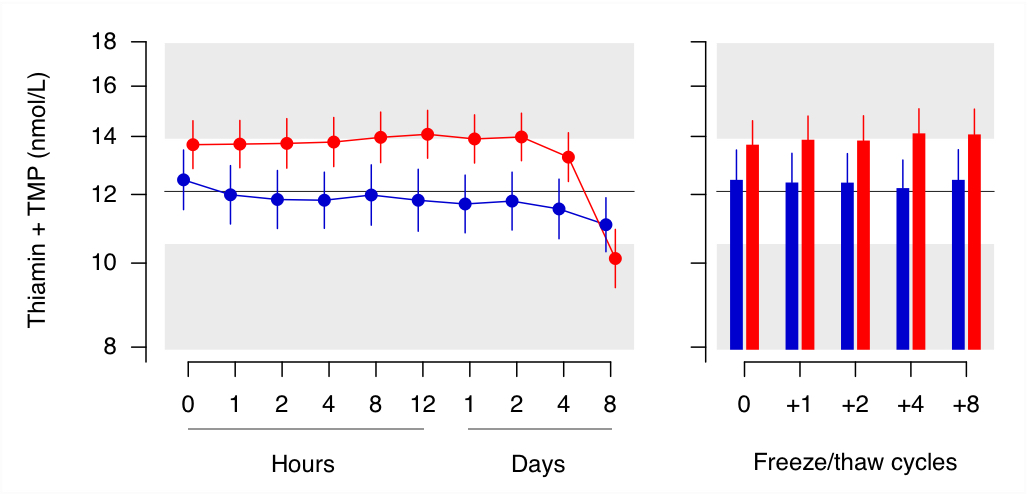
For the pair of thiamine monophosphate (TMP) / thiamine characterized by interconversion, the lower panel shows the concentration of the two metabolites combined. Thus, summarizing the concentrations of such source-product pairs is a useful strategy to correct for preanalytical instability.
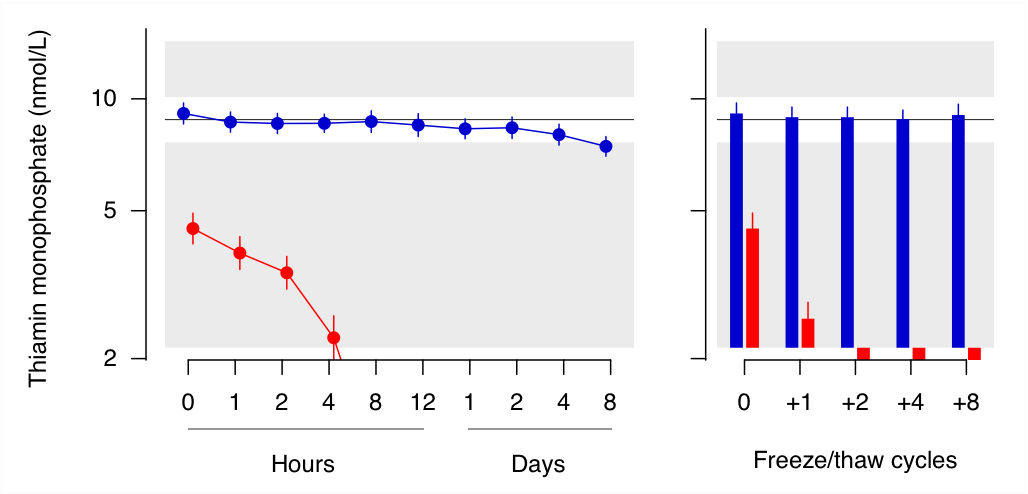

For the pair of thiamine monophosphate (TMP) / thiamine characterized by interconversion, the lower panel shows the concentration of the two metabolites combined. Thus, summarizing the concentrations of such source-product pairs is a useful strategy to correct for preanalytical instability.
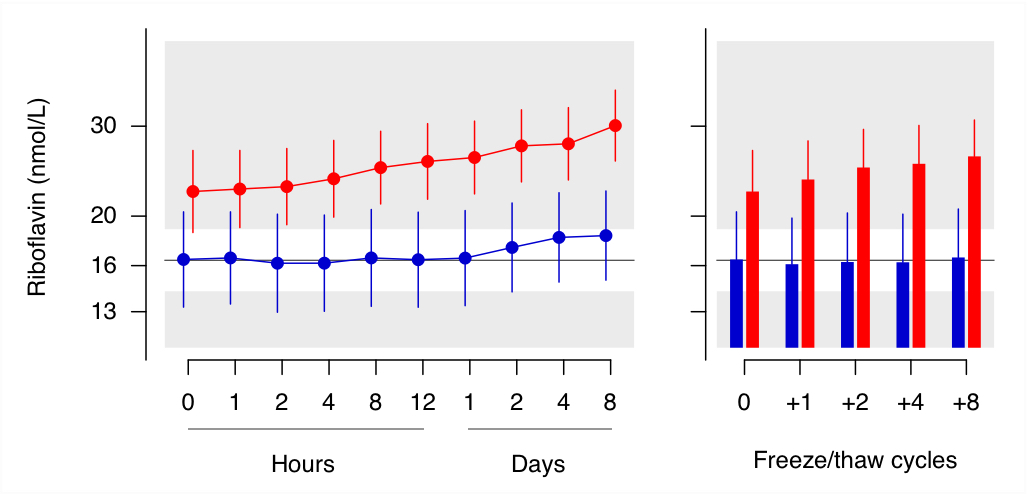
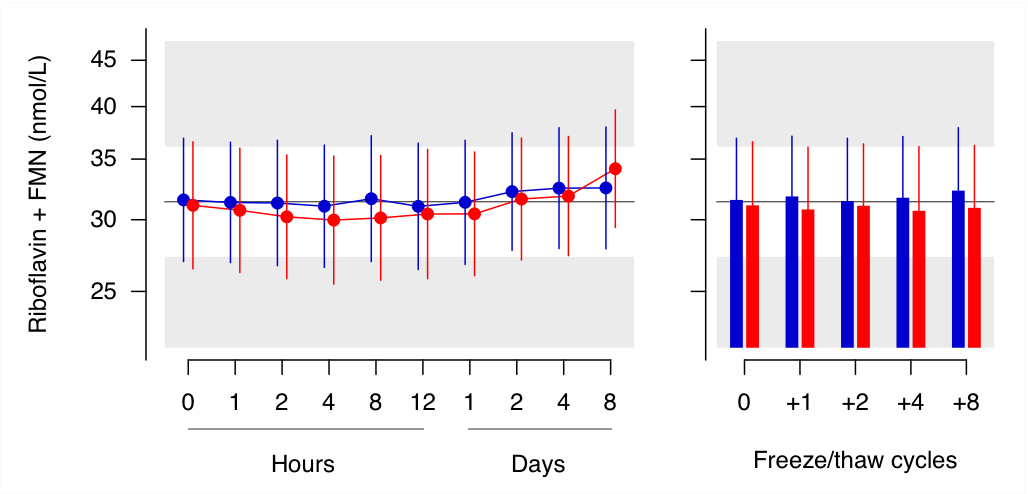
For the pair of Riboflavin / FMN characterized by interconversion, the lower panel shows the concentration of the two metabolites combined. Thus, summarizing the concentrations of such source-product pairs is a useful strategy to correct for preanalytical instability.
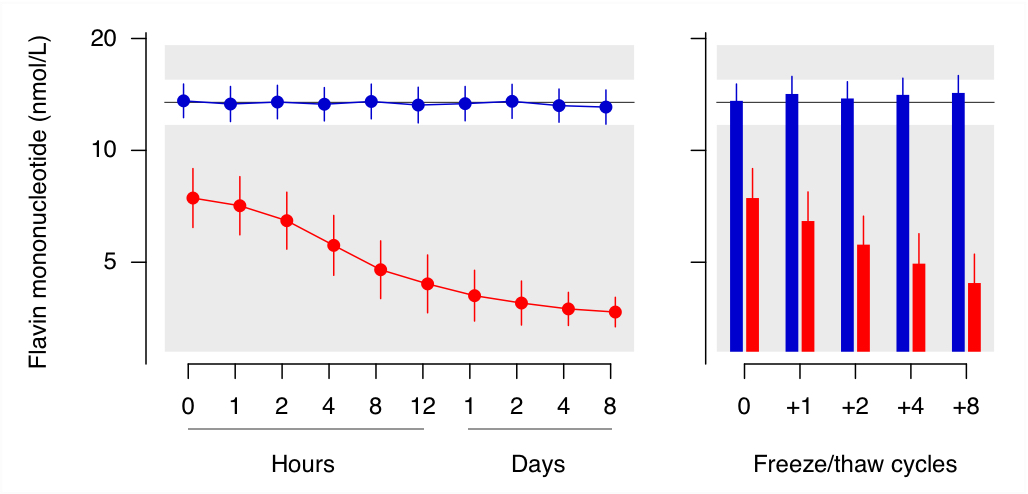

For the pair of Riboflavin / FMN characterized by interconversion, the lower panel shows the concentration of the two metabolites combined. Thus, summarizing the concentrations of such source-product pairs is a useful strategy to correct for preanalytical instability.

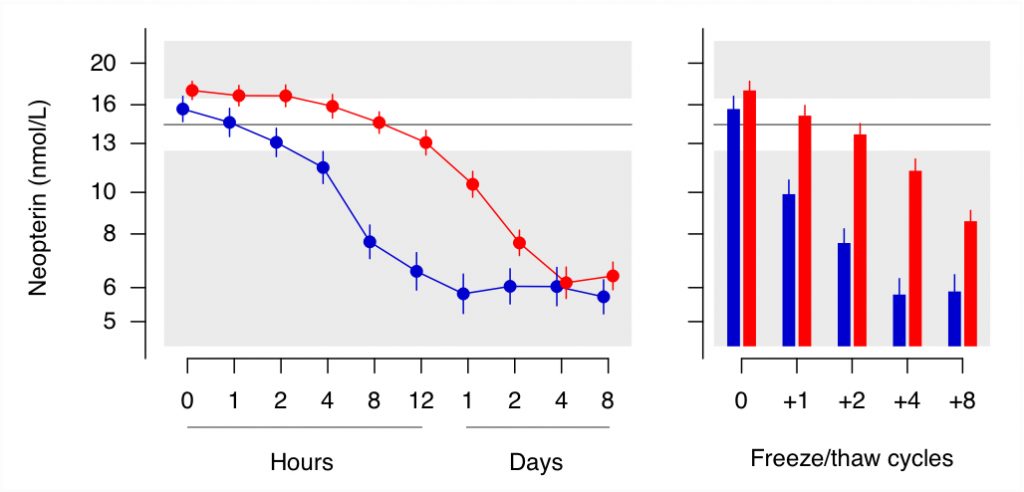


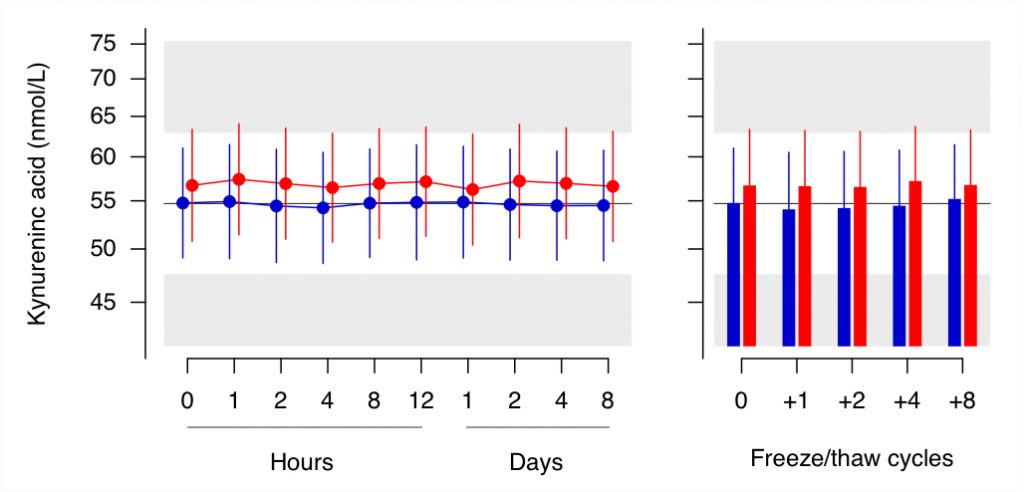
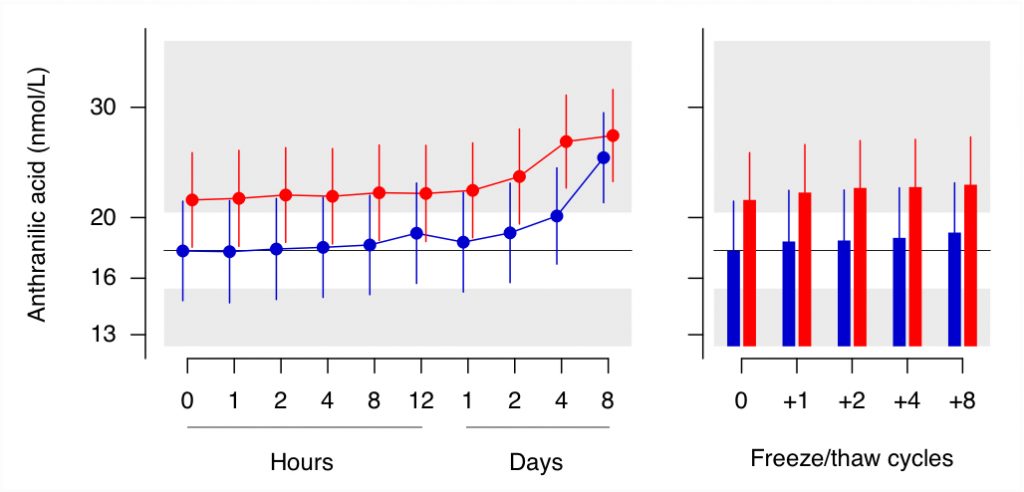
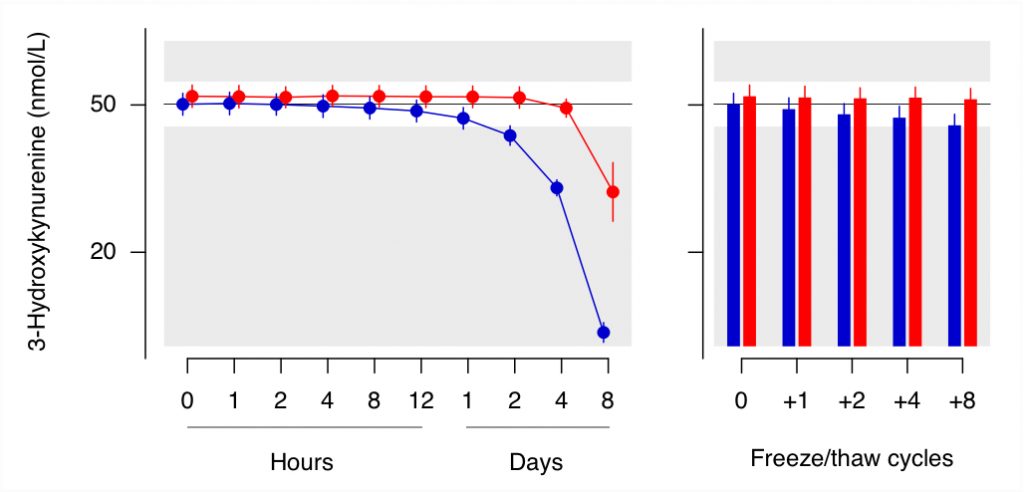
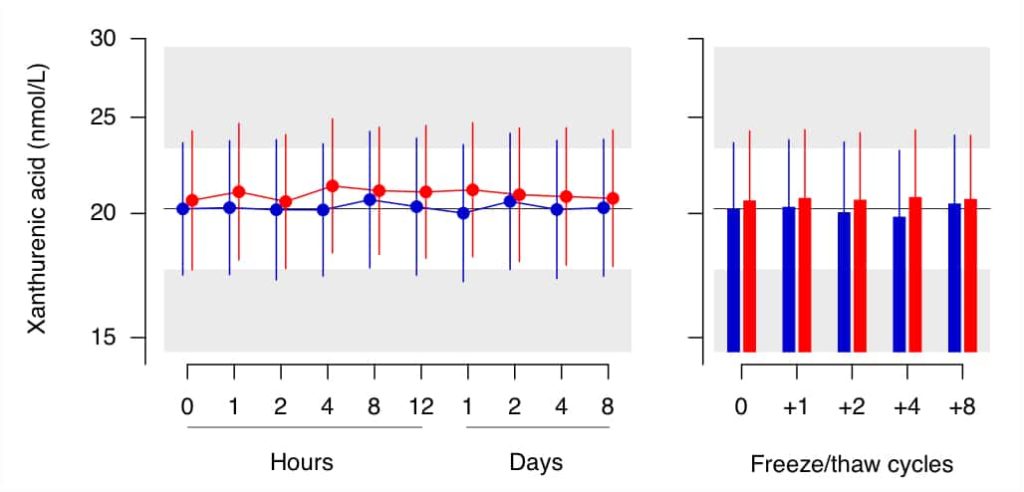
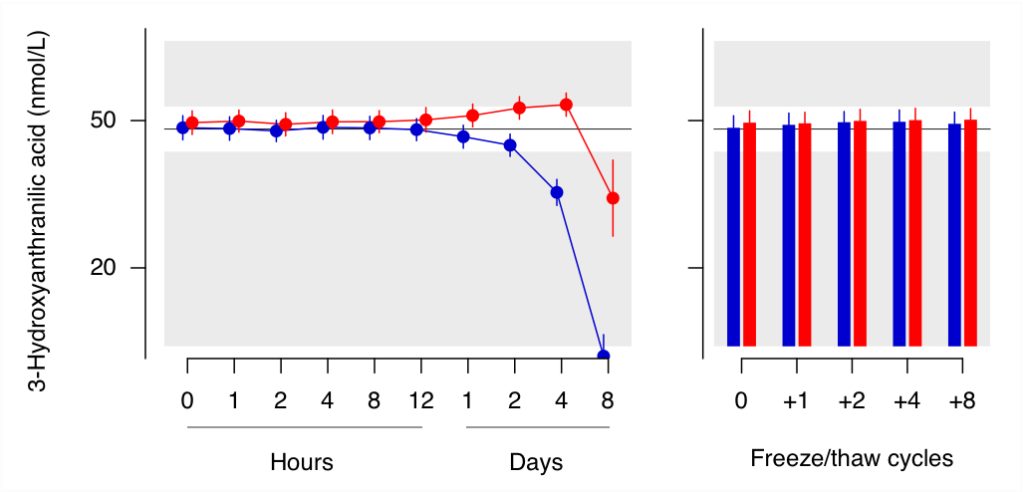
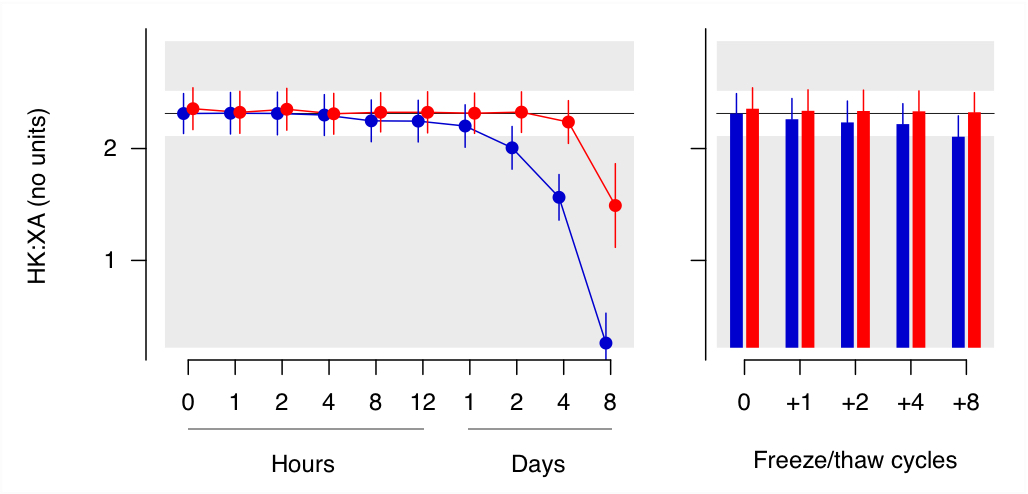
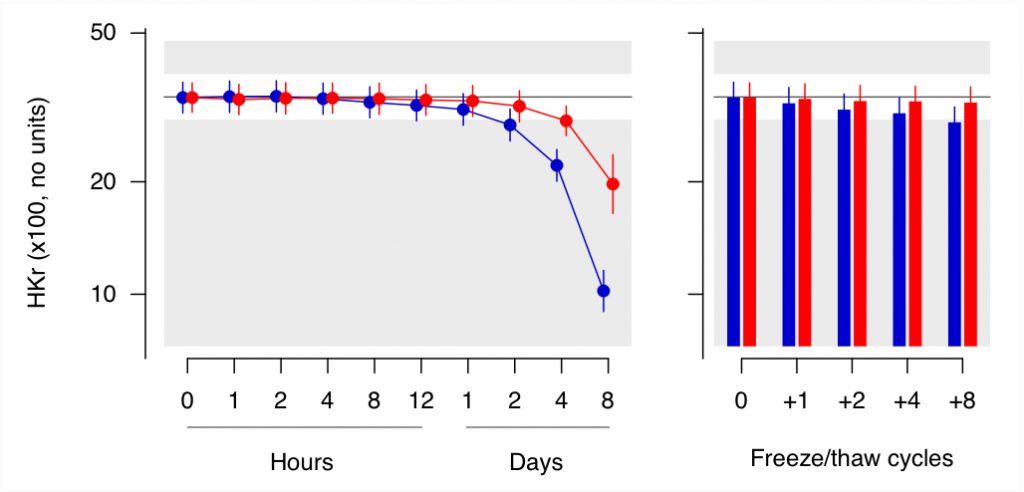
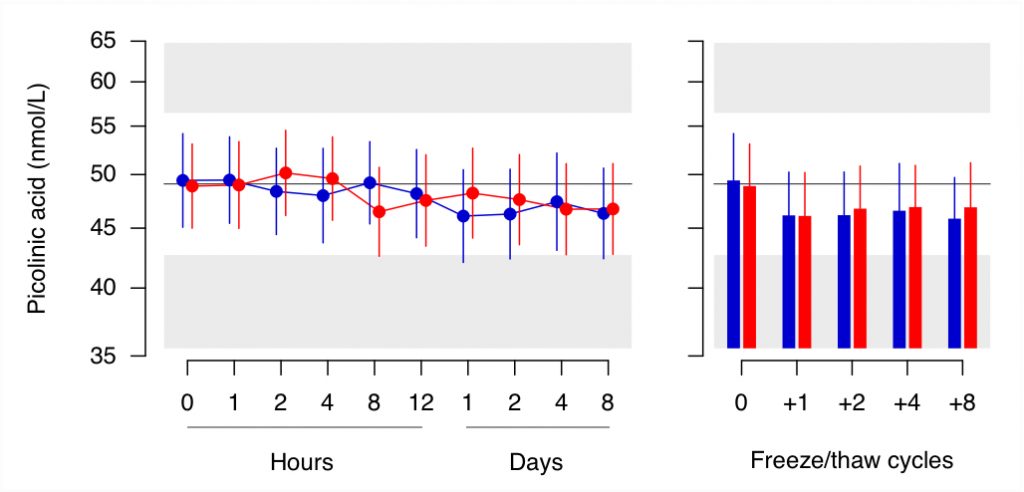
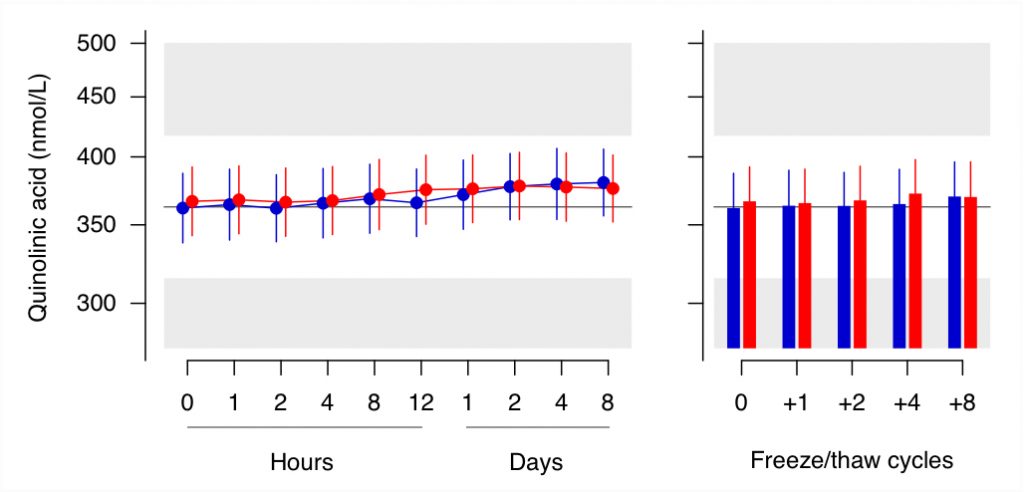
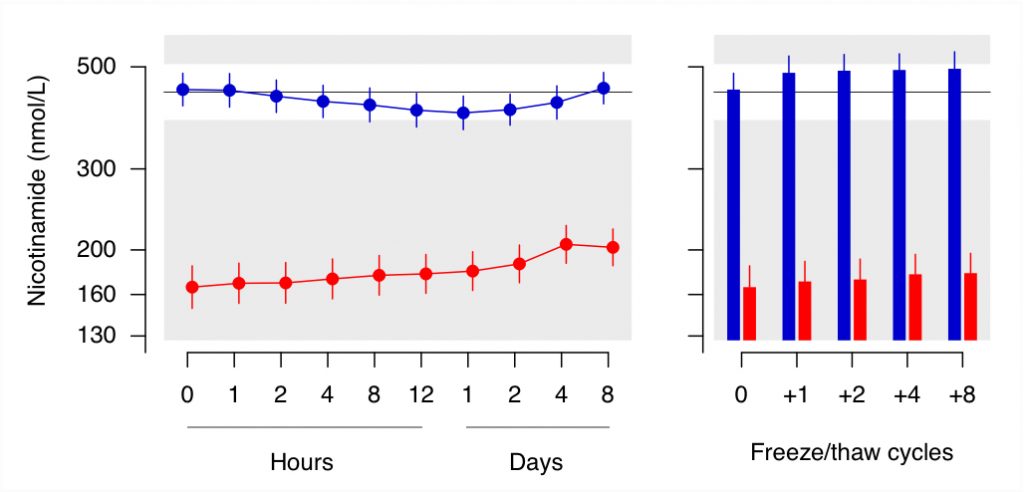
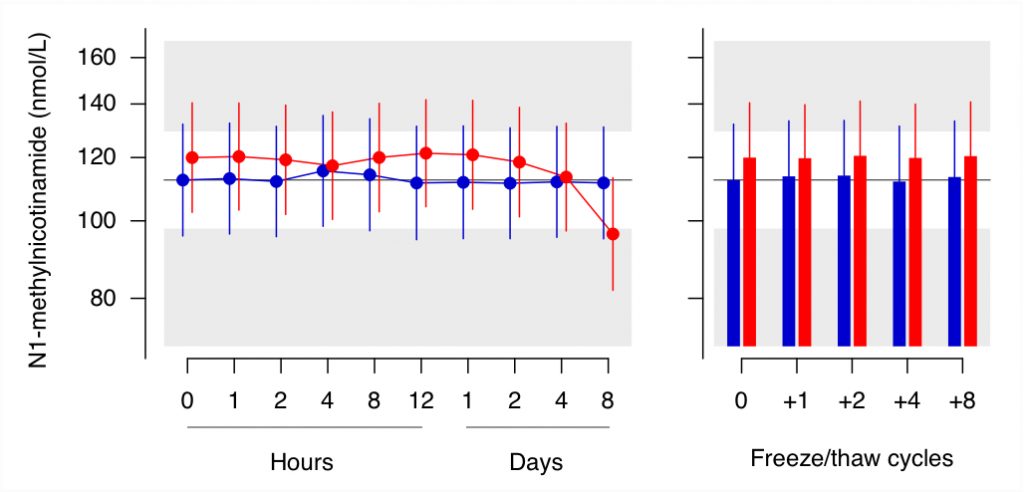
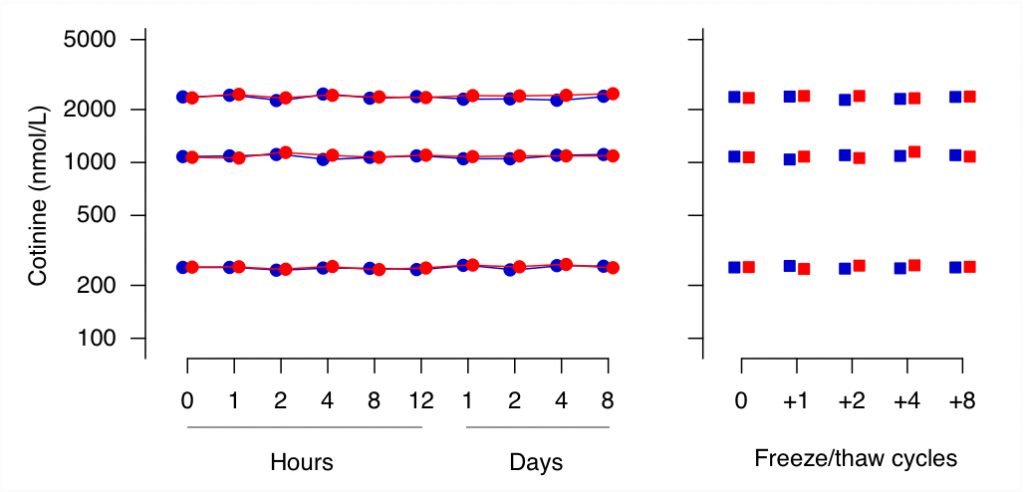
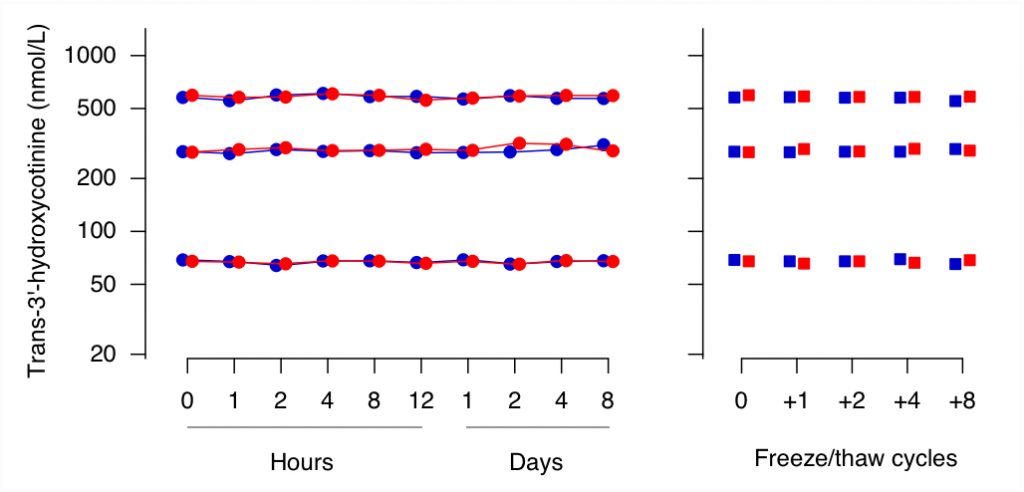
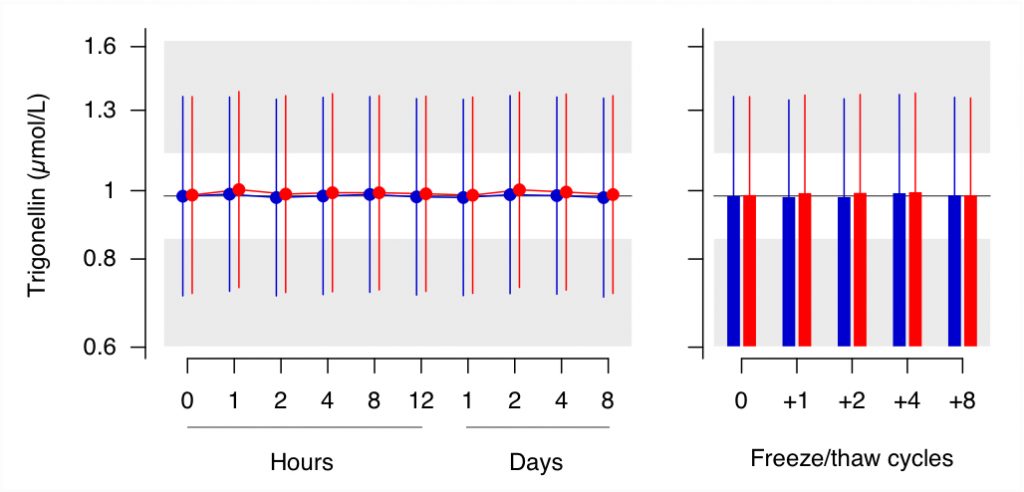
The panels (click on biomarkers above) show the stability of all biomarkers in EDTA plasma and serum at room temperature (left) for the indicated duration and after increasing number of freeze-thaw cycles (right). The white zone indicates +/- 15% deviation from the average of the first three time points for plasma. Data are given as geometric mean with standard error (SE) for samples from 15 healthy subjects.
Folate species and catabolites.
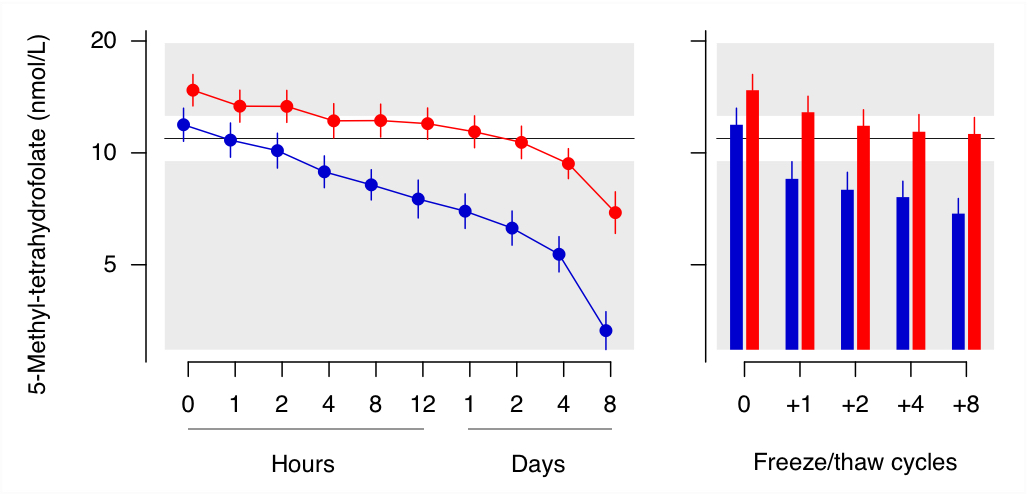
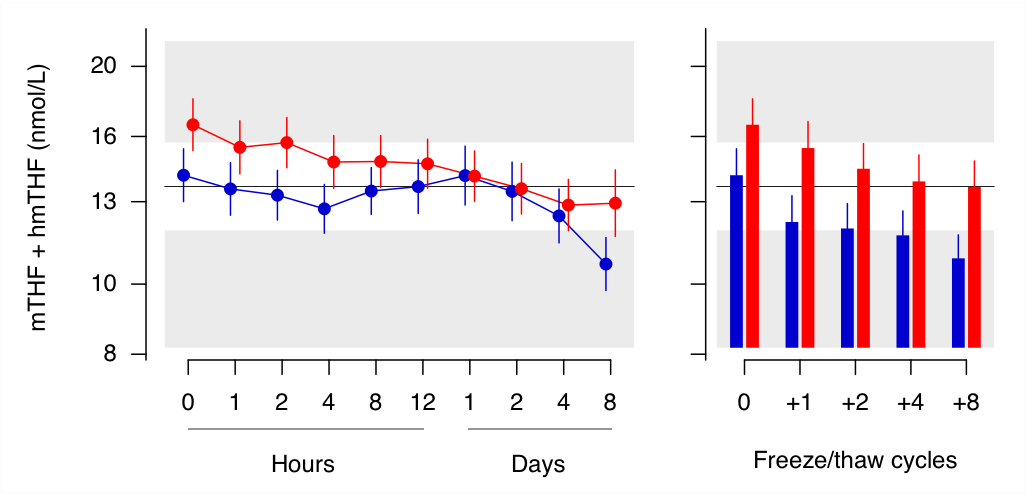
For the pair of 5-methyl-tetrahydrofolate / 4-alfa-hydroxy-5-methyl-THF characterized by interconversion, the lower panel shows the concentration of the two metabolites combined. Thus, summarizing the concentrations of such source-product pairs is a useful strategy to correct for preanalytical instability.
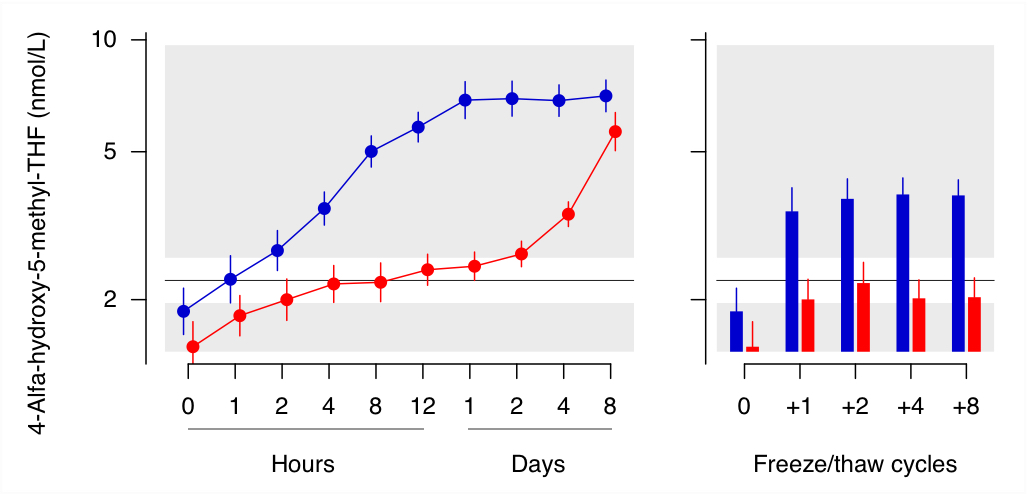

For the pair of 5-methyl-tetrahydrofolate / 4-alfa-hydroxy-5-methyl-THF characterized by interconversion, the lower panel shows the concentration of the two metabolites combined. Thus, summarizing the concentrations of such source-product pairs is a useful strategy to correct for preanalytical instability.
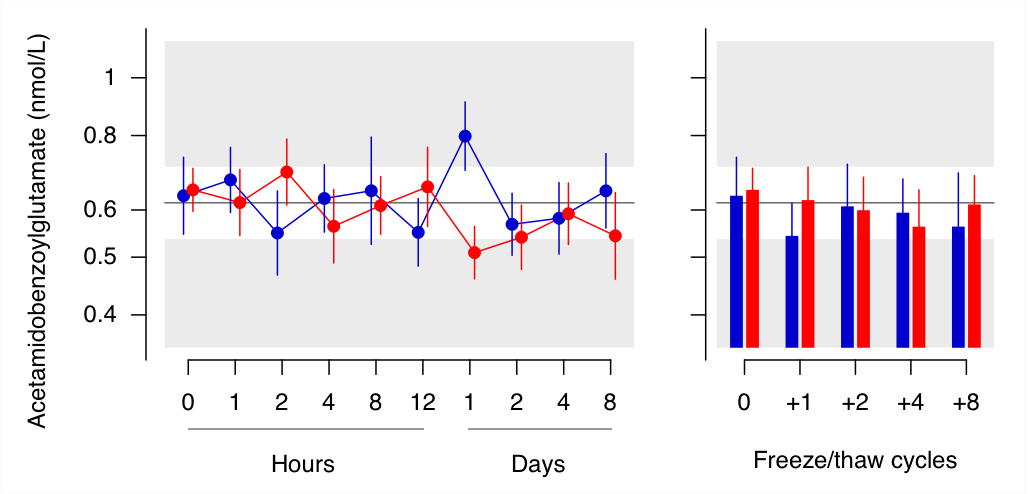
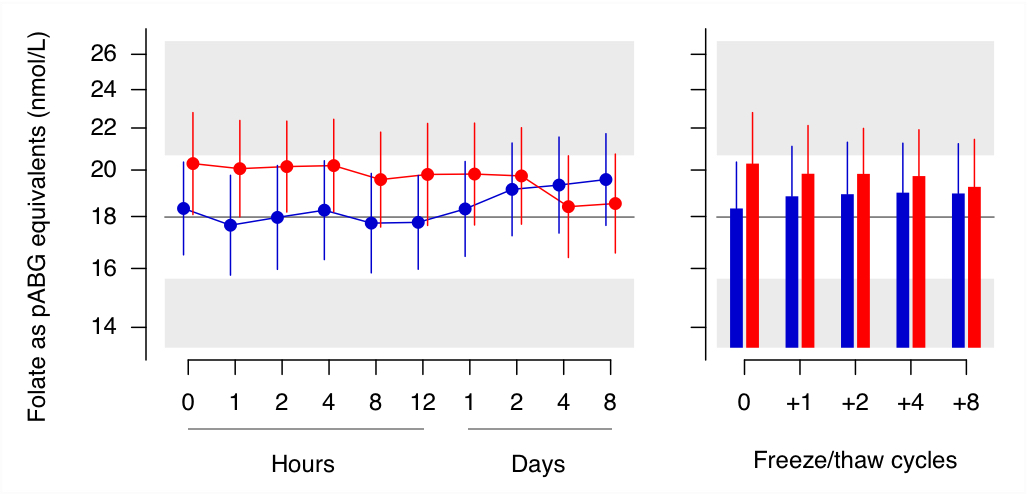
The panels (click on biomarkers above) show the stability of all biomarkers in EDTA plasma and serum at room temperature (left) for the indicated duration and after increasing number of freeze-thaw cycles (right). The white zone indicates +/- 15% deviation from the average of the first three time points for plasma. Data are given as geometric mean with standard error (SE) for samples from 15 healthy subjects.
Folate (B9) and cobalamin (B12).
The panels (click on biomarkers above) show the stability of all biomarkers in EDTA plasma and serum at room temperature (left) for the indicated duration and after increasing number of freeze-thaw cycles (right). The white zone indicates +/- 15% deviation from the average of the first three time points for plasma. Data are given as geometric mean with standard error (SE) for samples from 15 healthy subjects.
Protein biomarkers
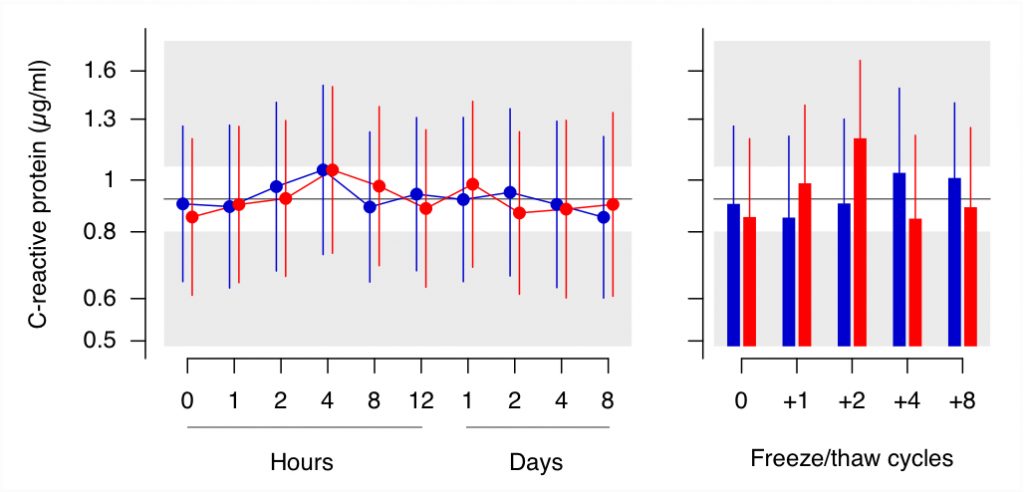
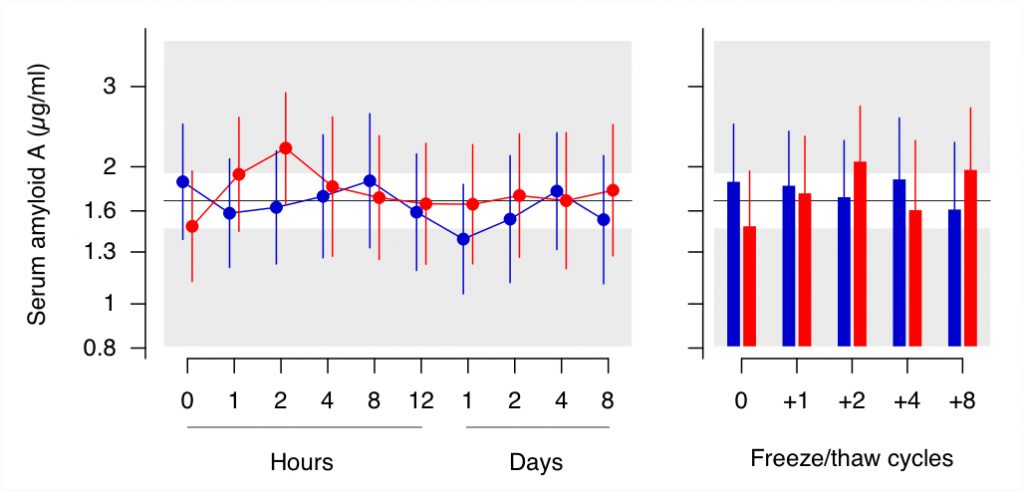
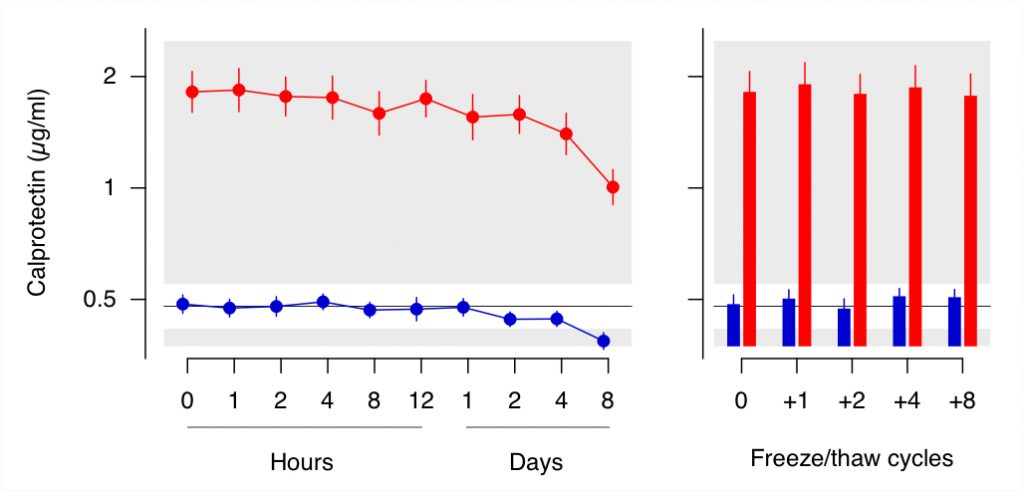
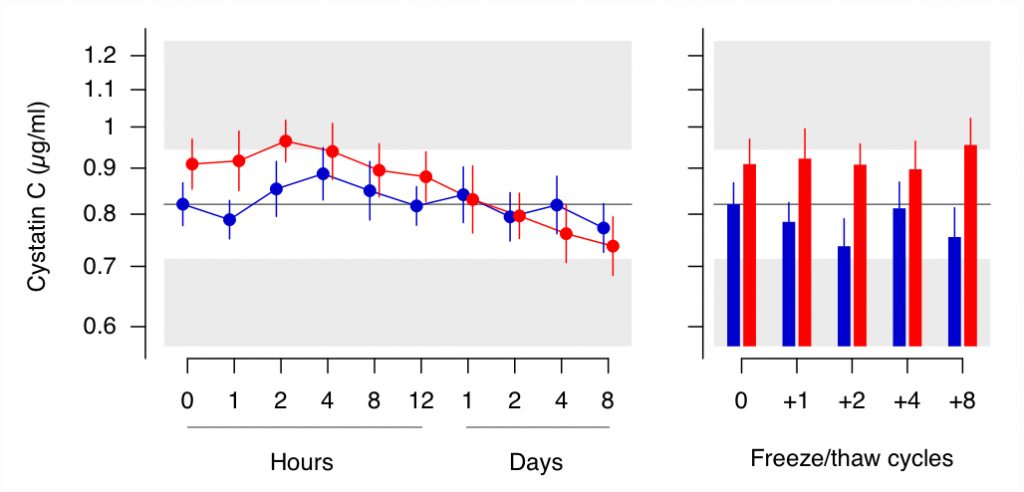
The panels (click on biomarkers above) show the stability of all biomarkers in EDTA plasma and serum at room temperature (left) for the indicated duration and after increasing number of freeze-thaw cycles (right). The white zone indicates +/- 15% deviation from the average of the first three time points for plasma. Data are given as geometric mean with standard error (SE) for samples from 15 healthy subjects.
Lipid-soluble vitamins.
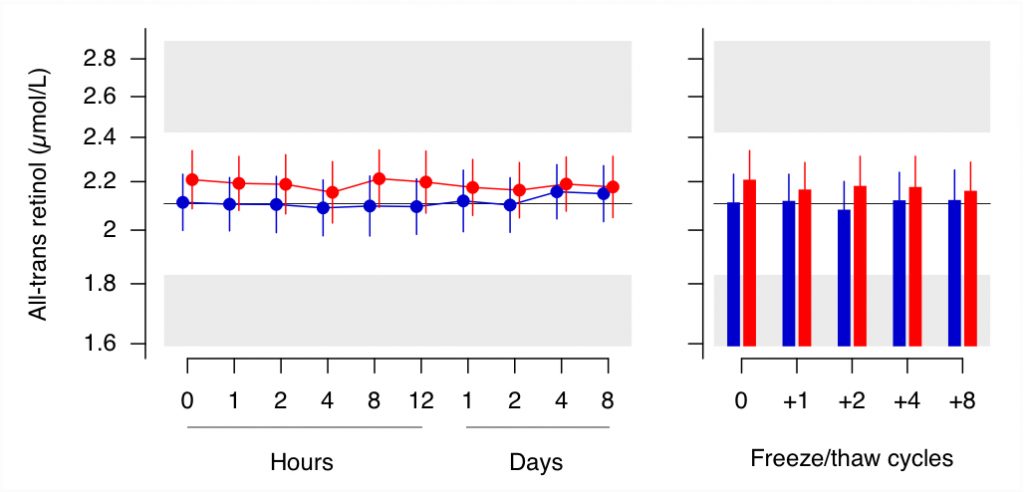
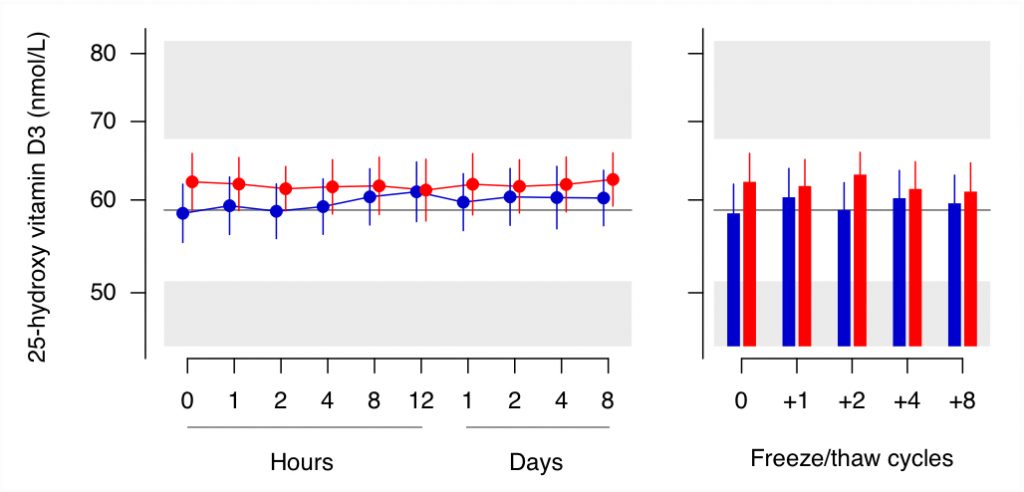
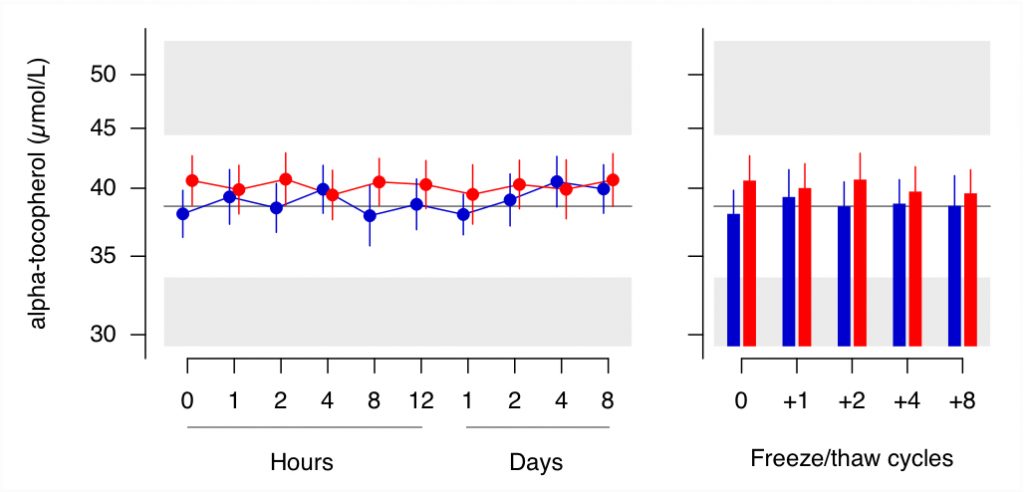
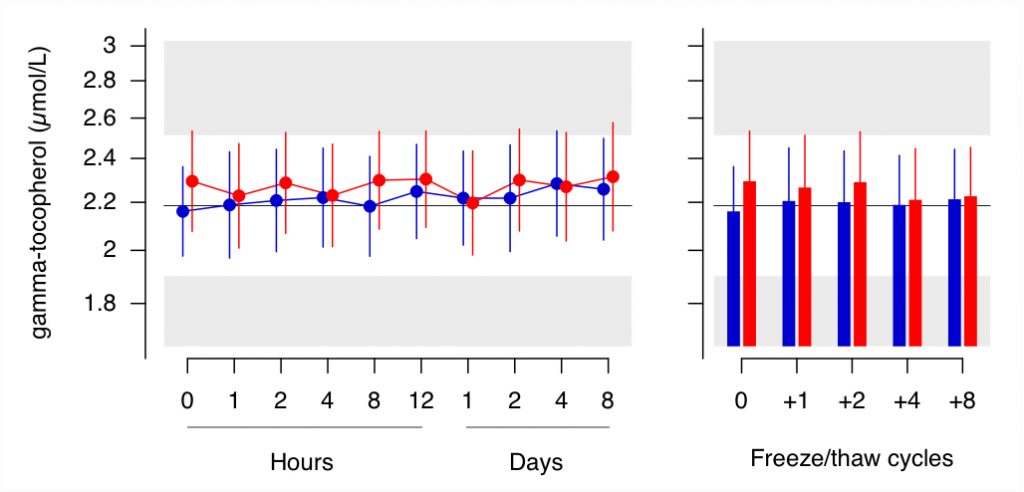
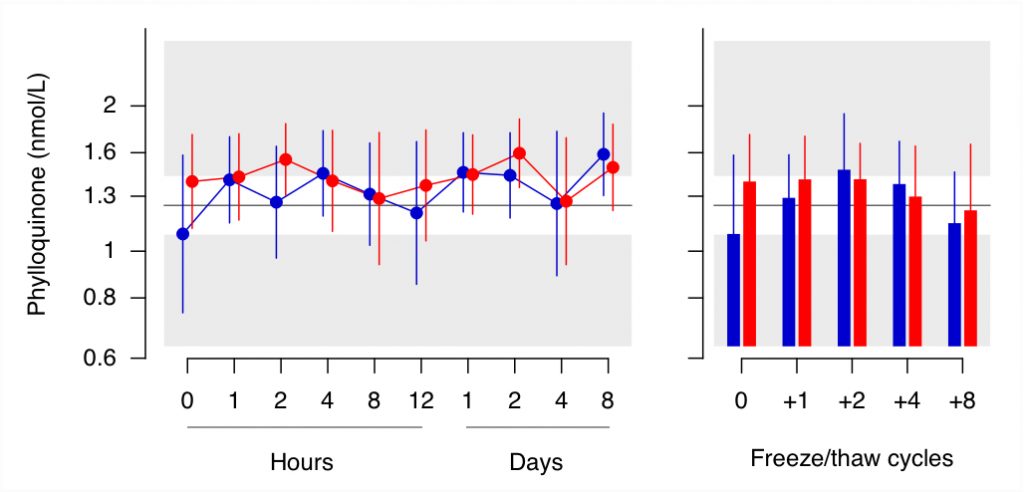
The panels (click on biomarkers above) show the stability of all biomarkers in EDTA plasma and serum at room temperature (left) for the indicated duration and after increasing number of freeze-thaw cycles (right). The white zone indicates +/- 15% deviation from the average of the first three time points for plasma. Data are given as geometric mean with standard error (SE) for samples from 15 healthy subjects.


